| Full name: carbonic anhydrase 14 | Alias Symbol: | ||
| Type: protein-coding gene | Cytoband: 1q21.2 | ||
| Entrez ID: 23632 | HGNC ID: HGNC:1372 | Ensembl Gene: ENSG00000118298 | OMIM ID: 604832 |
| Related drugs: ACETAZOLAMIDE, BRINZOLAMIDE, CHLORTHALIDONE, DORZOLAMIDE, ETHOXZOLAMIDE, METHAZOLAMIDE... [more] | |||
Expression of CA14:
| Dataset | Gene | EntrezID | Probe | Log2FC | Adj.pValue | Expression |
|---|---|---|---|---|---|---|
| GSE17351 | CA14 | 23632 | 219464_at | -0.0747 | 0.8880 | |
| GSE20347 | CA14 | 23632 | 219464_at | -0.0190 | 0.8488 | |
| GSE23400 | CA14 | 23632 | 219464_at | -0.0633 | 0.1785 | |
| GSE26886 | CA14 | 23632 | 219464_at | 0.0990 | 0.5028 | |
| GSE29001 | CA14 | 23632 | 219464_at | -0.1544 | 0.4056 | |
| GSE38129 | CA14 | 23632 | 219464_at | -0.1413 | 0.1754 | |
| GSE45670 | CA14 | 23632 | 219464_at | 0.0424 | 0.7926 | |
| GSE53622 | CA14 | 23632 | 114604 | 0.1698 | 0.0920 | |
| GSE53624 | CA14 | 23632 | 114604 | -0.0461 | 0.6278 | |
| GSE63941 | CA14 | 23632 | 219464_at | 0.3970 | 0.0684 | |
| GSE77861 | CA14 | 23632 | 219464_at | 0.0062 | 0.9736 | |
| GSE97050 | CA14 | 23632 | A_23_P63379 | -0.1280 | 0.6217 | |
| SRP133303 | CA14 | 23632 | RNAseq | -0.5677 | 0.0201 | |
| TCGA | CA14 | 23632 | RNAseq | -0.9489 | 0.0001 |
Upregulated datasets: 0; Downregulated datasets: 0.
Survival by CA14 expression:
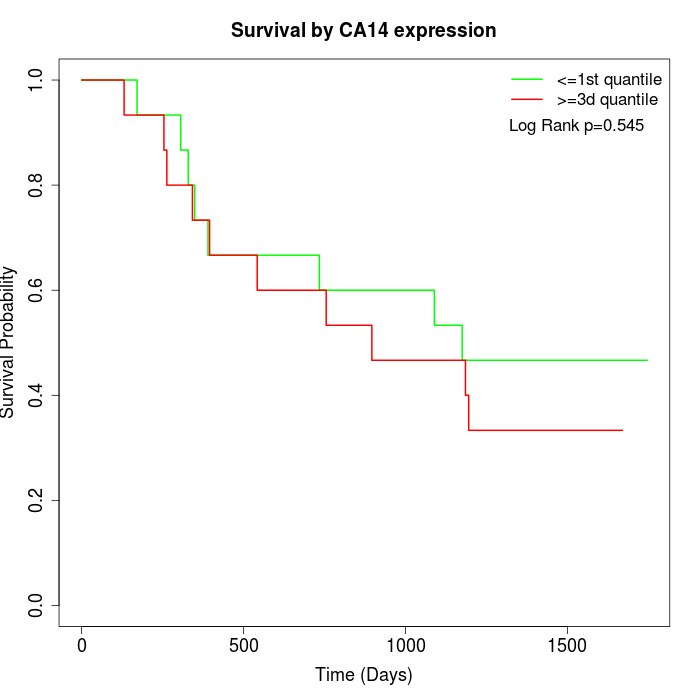 | 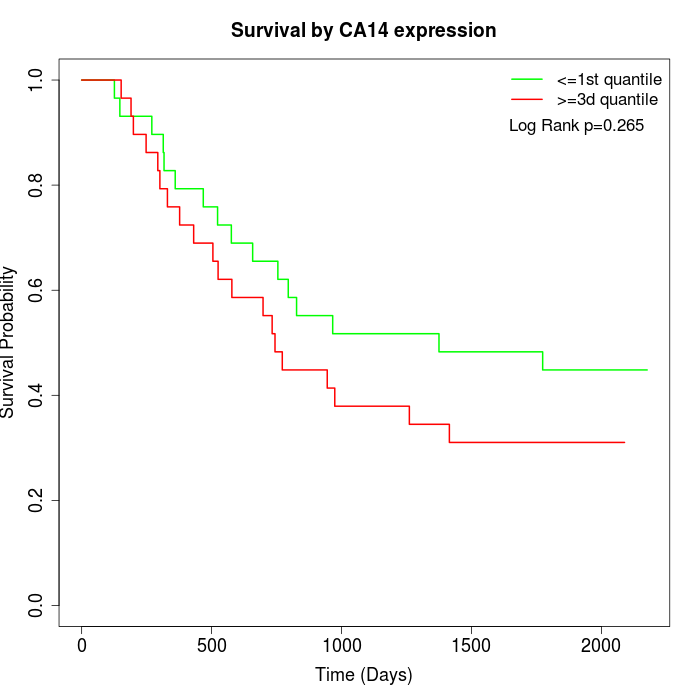 | 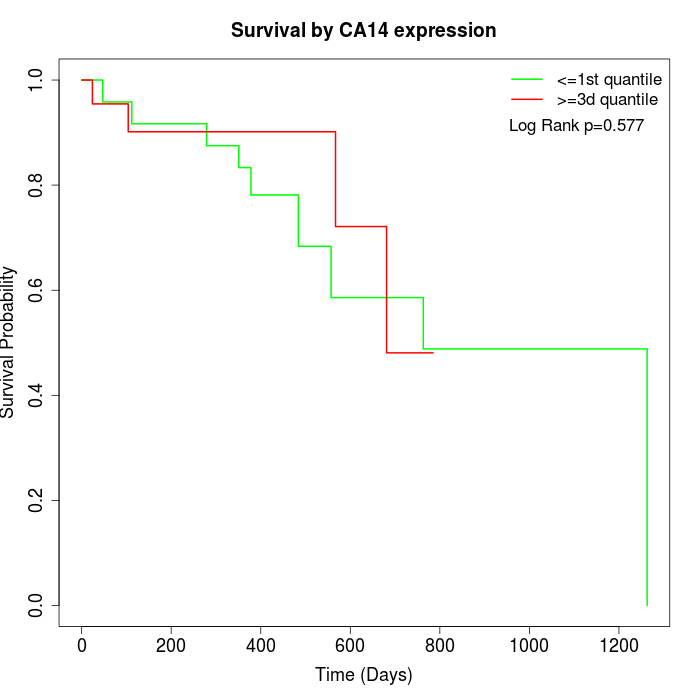 |
| GSE53622 | GSE53624 | TCGA |
Note: Click image to view full size file.
Copy number change of CA14:
| Dataset | Gene | EntrezID | Gain | Loss | Normal | Detail |
|---|---|---|---|---|---|---|
| GSE15526 | CA14 | 23632 | 15 | 0 | 15 | |
| GSE20123 | CA14 | 23632 | 15 | 0 | 15 | |
| GSE43470 | CA14 | 23632 | 6 | 1 | 36 | |
| GSE46452 | CA14 | 23632 | 2 | 1 | 56 | |
| GSE47630 | CA14 | 23632 | 14 | 0 | 26 | |
| GSE54993 | CA14 | 23632 | 0 | 3 | 67 | |
| GSE54994 | CA14 | 23632 | 15 | 0 | 38 | |
| GSE60625 | CA14 | 23632 | 0 | 0 | 11 | |
| GSE74703 | CA14 | 23632 | 6 | 1 | 29 | |
| GSE74704 | CA14 | 23632 | 7 | 0 | 13 | |
| TCGA | CA14 | 23632 | 38 | 2 | 56 |
Total number of gains: 118; Total number of losses: 8; Total Number of normals: 362.
Somatic mutations of CA14:
Generating mutation plots.
Highly correlated genes for CA14:
Showing top 20/800 corelated genes with mean PCC>0.5.
| Gene1 | Gene2 | Mean PCC | Num. Datasets | Num. PCC<0 | Num. PCC>0.5 |
|---|---|---|---|---|---|
| CA14 | STXBP6 | 0.780022 | 3 | 0 | 3 |
| CA14 | UBAP1L | 0.725671 | 3 | 0 | 3 |
| CA14 | HPYR1 | 0.713042 | 3 | 0 | 3 |
| CA14 | C9orf47 | 0.712515 | 3 | 0 | 3 |
| CA14 | NKX6-1 | 0.690847 | 3 | 0 | 3 |
| CA14 | BTN1A1 | 0.690183 | 7 | 0 | 7 |
| CA14 | GLP1R | 0.683632 | 6 | 0 | 6 |
| CA14 | PRLR | 0.679846 | 3 | 0 | 3 |
| CA14 | HTR1D | 0.679047 | 5 | 0 | 4 |
| CA14 | F2 | 0.674635 | 4 | 0 | 3 |
| CA14 | TSGA13 | 0.672246 | 4 | 0 | 4 |
| CA14 | CCL16 | 0.671869 | 4 | 0 | 4 |
| CA14 | SERPINA2 | 0.668077 | 3 | 0 | 3 |
| CA14 | NTNG1 | 0.662453 | 4 | 0 | 4 |
| CA14 | KRTAP5-9 | 0.662145 | 5 | 0 | 5 |
| CA14 | KCNC1 | 0.660914 | 6 | 0 | 6 |
| CA14 | NELL1 | 0.658231 | 3 | 0 | 3 |
| CA14 | CIITA | 0.658206 | 7 | 0 | 7 |
| CA14 | UBQLN3 | 0.657124 | 7 | 0 | 7 |
| CA14 | SIX6 | 0.655288 | 5 | 0 | 5 |
For details and further investigation, click here