| Full name: calcium binding protein 39 | Alias Symbol: CGI-66|MO25 | ||
| Type: protein-coding gene | Cytoband: 2q37.1 | ||
| Entrez ID: 51719 | HGNC ID: HGNC:20292 | Ensembl Gene: ENSG00000135932 | OMIM ID: 612174 |
Screen Evidence:
| |||
CAB39 involved pathways:
| KEGG pathway | Description | View |
|---|---|---|
| hsa04150 | mTOR signaling pathway | |
| hsa04152 | AMPK signaling pathway |
Expression of CAB39:
| Dataset | Gene | EntrezID | Probe | Log2FC | Adj.pValue | Expression |
|---|---|---|---|---|---|---|
| GSE17351 | CAB39 | 51719 | 217873_at | -0.2644 | 0.4479 | |
| GSE20347 | CAB39 | 51719 | 217873_at | -0.8879 | 0.0000 | |
| GSE23400 | CAB39 | 51719 | 217873_at | -0.5010 | 0.0000 | |
| GSE26886 | CAB39 | 51719 | 217873_at | -1.5476 | 0.0000 | |
| GSE29001 | CAB39 | 51719 | 217873_at | -0.5196 | 0.0255 | |
| GSE38129 | CAB39 | 51719 | 217873_at | -0.8082 | 0.0000 | |
| GSE45670 | CAB39 | 51719 | 217873_at | -0.2350 | 0.1572 | |
| GSE53622 | CAB39 | 51719 | 57890 | -0.5543 | 0.0000 | |
| GSE53624 | CAB39 | 51719 | 8750 | -0.7794 | 0.0000 | |
| GSE63941 | CAB39 | 51719 | 217873_at | -0.3854 | 0.3523 | |
| GSE77861 | CAB39 | 51719 | 217873_at | -0.3764 | 0.1134 | |
| GSE97050 | CAB39 | 51719 | A_33_P3316293 | 0.0611 | 0.8919 | |
| SRP007169 | CAB39 | 51719 | RNAseq | -1.9123 | 0.0000 | |
| SRP008496 | CAB39 | 51719 | RNAseq | -1.5598 | 0.0000 | |
| SRP064894 | CAB39 | 51719 | RNAseq | -0.5864 | 0.0091 | |
| SRP133303 | CAB39 | 51719 | RNAseq | -0.0536 | 0.7440 | |
| SRP159526 | CAB39 | 51719 | RNAseq | -0.9175 | 0.0037 | |
| SRP193095 | CAB39 | 51719 | RNAseq | -0.5581 | 0.0009 | |
| SRP219564 | CAB39 | 51719 | RNAseq | -0.4610 | 0.2280 | |
| TCGA | CAB39 | 51719 | RNAseq | -0.1254 | 0.0103 |
Upregulated datasets: 0; Downregulated datasets: 3.
Survival by CAB39 expression:
 | 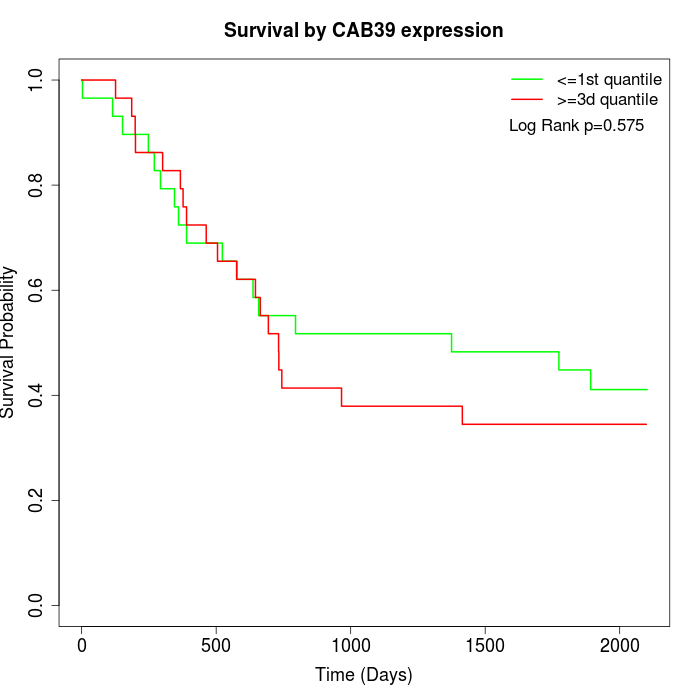 | 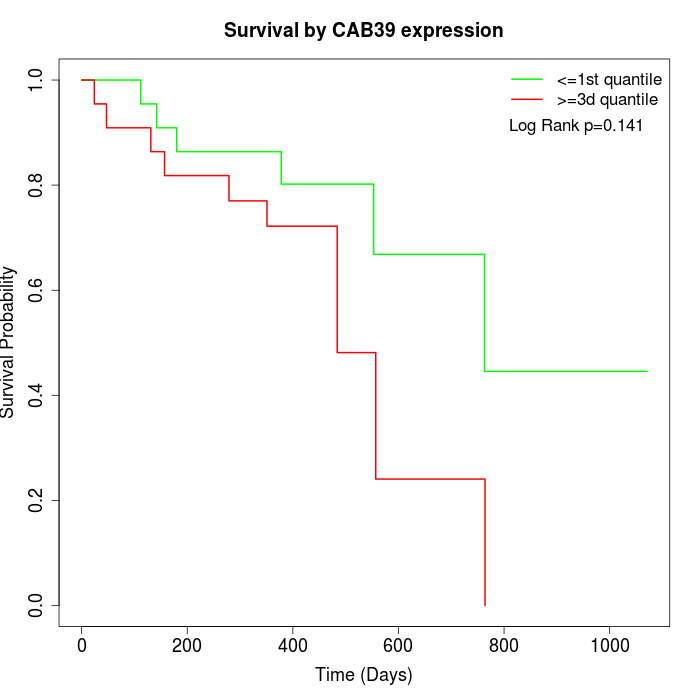 |
| GSE53622 | GSE53624 | TCGA |
Note: Click image to view full size file.
Copy number change of CAB39:
| Dataset | Gene | EntrezID | Gain | Loss | Normal | Detail |
|---|---|---|---|---|---|---|
| GSE15526 | CAB39 | 51719 | 1 | 13 | 16 | |
| GSE20123 | CAB39 | 51719 | 1 | 13 | 16 | |
| GSE43470 | CAB39 | 51719 | 2 | 8 | 33 | |
| GSE46452 | CAB39 | 51719 | 0 | 5 | 54 | |
| GSE47630 | CAB39 | 51719 | 4 | 5 | 31 | |
| GSE54993 | CAB39 | 51719 | 2 | 2 | 66 | |
| GSE54994 | CAB39 | 51719 | 6 | 11 | 36 | |
| GSE60625 | CAB39 | 51719 | 0 | 3 | 8 | |
| GSE74703 | CAB39 | 51719 | 2 | 6 | 28 | |
| GSE74704 | CAB39 | 51719 | 1 | 7 | 12 | |
| TCGA | CAB39 | 51719 | 13 | 27 | 56 |
Total number of gains: 32; Total number of losses: 100; Total Number of normals: 356.
Somatic mutations of CAB39:
Generating mutation plots.
Highly correlated genes for CAB39:
Showing top 20/843 corelated genes with mean PCC>0.5.
| Gene1 | Gene2 | Mean PCC | Num. Datasets | Num. PCC<0 | Num. PCC>0.5 |
|---|---|---|---|---|---|
| CAB39 | TMEM161B | 0.757958 | 3 | 0 | 3 |
| CAB39 | CMTR2 | 0.739837 | 3 | 0 | 3 |
| CAB39 | PRMT9 | 0.699646 | 4 | 0 | 4 |
| CAB39 | GSKIP | 0.669362 | 6 | 0 | 4 |
| CAB39 | GNG12 | 0.669316 | 12 | 0 | 10 |
| CAB39 | MAP4K5 | 0.668561 | 4 | 0 | 3 |
| CAB39 | CAPZB | 0.664552 | 7 | 0 | 6 |
| CAB39 | ATXN3 | 0.664143 | 3 | 0 | 3 |
| CAB39 | MAGI3 | 0.657978 | 4 | 0 | 3 |
| CAB39 | ELK3 | 0.657681 | 12 | 0 | 11 |
| CAB39 | VTA1 | 0.656066 | 4 | 0 | 4 |
| CAB39 | GOLGA4 | 0.648441 | 8 | 0 | 6 |
| CAB39 | HIGD1A | 0.647612 | 10 | 0 | 9 |
| CAB39 | SREK1IP1 | 0.647373 | 9 | 0 | 8 |
| CAB39 | GRPEL2 | 0.647287 | 6 | 0 | 5 |
| CAB39 | ZNF92 | 0.643795 | 3 | 0 | 3 |
| CAB39 | PLIN3 | 0.643529 | 11 | 0 | 9 |
| CAB39 | PDLIM2 | 0.641008 | 8 | 0 | 6 |
| CAB39 | CCDC6 | 0.638754 | 9 | 0 | 8 |
| CAB39 | UBL3 | 0.636048 | 9 | 0 | 8 |
For details and further investigation, click here