| Full name: vesicle trafficking 1 | Alias Symbol: HSPC228|My012 | ||
| Type: protein-coding gene | Cytoband: 6q24.1-q24.2 | ||
| Entrez ID: 51534 | HGNC ID: HGNC:20954 | Ensembl Gene: ENSG00000009844 | OMIM ID: 610902 |
Screen Evidence:
| |||
Expression of VTA1:
| Dataset | Gene | EntrezID | Probe | Log2FC | Adj.pValue | Expression |
|---|---|---|---|---|---|---|
| GSE17351 | VTA1 | 51534 | 224437_s_at | 0.0447 | 0.9563 | |
| GSE26886 | VTA1 | 51534 | 224437_s_at | -0.4558 | 0.0188 | |
| GSE45670 | VTA1 | 51534 | 224437_s_at | 0.1586 | 0.1667 | |
| GSE53622 | VTA1 | 51534 | 169298 | 0.0229 | 0.7807 | |
| GSE53624 | VTA1 | 51534 | 169298 | -0.0882 | 0.1127 | |
| GSE63941 | VTA1 | 51534 | 224437_s_at | 0.1578 | 0.6419 | |
| GSE77861 | VTA1 | 51534 | 224437_s_at | -0.4821 | 0.1371 | |
| GSE97050 | VTA1 | 51534 | A_23_P42368 | 0.4309 | 0.2917 | |
| SRP007169 | VTA1 | 51534 | RNAseq | -0.9446 | 0.0057 | |
| SRP008496 | VTA1 | 51534 | RNAseq | -0.8680 | 0.0000 | |
| SRP064894 | VTA1 | 51534 | RNAseq | -0.3487 | 0.0741 | |
| SRP133303 | VTA1 | 51534 | RNAseq | 0.0884 | 0.5284 | |
| SRP159526 | VTA1 | 51534 | RNAseq | -0.4982 | 0.0673 | |
| SRP193095 | VTA1 | 51534 | RNAseq | -0.6821 | 0.0000 | |
| SRP219564 | VTA1 | 51534 | RNAseq | -0.5513 | 0.1823 | |
| TCGA | VTA1 | 51534 | RNAseq | 0.1724 | 0.0004 |
Upregulated datasets: 0; Downregulated datasets: 0.
Survival by VTA1 expression:
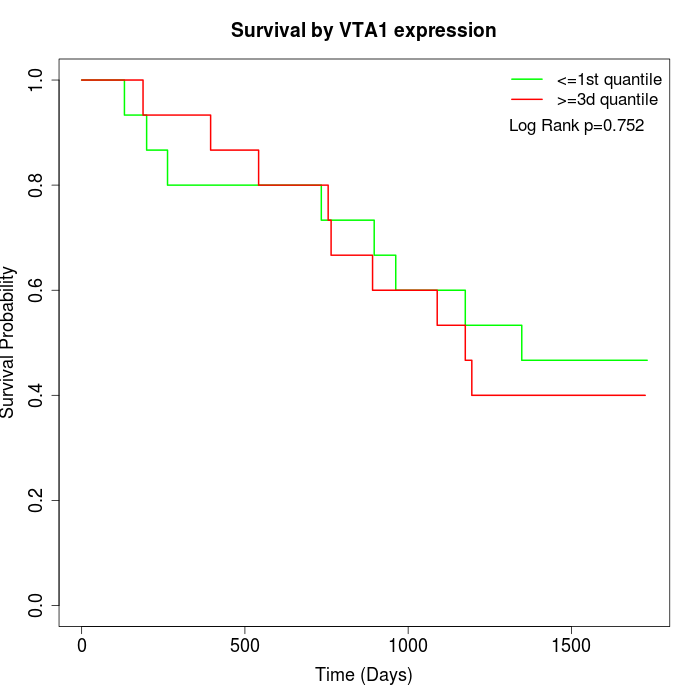 | 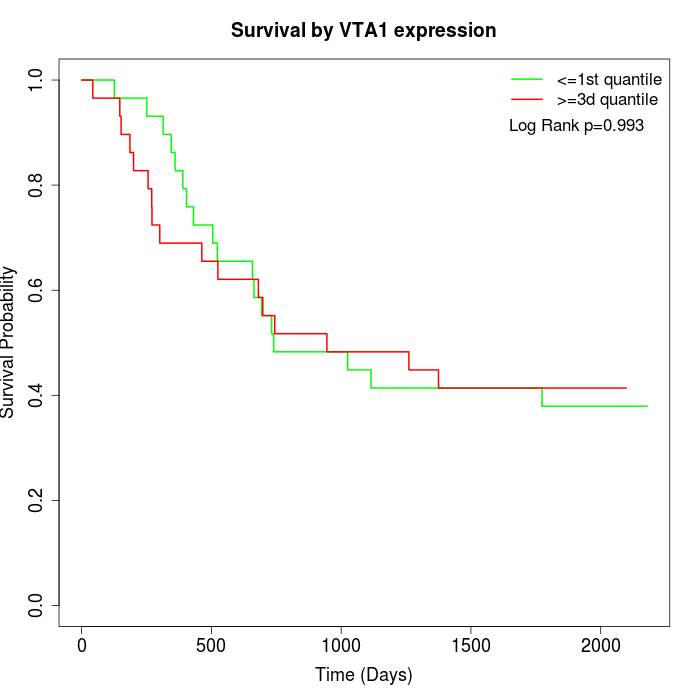 | 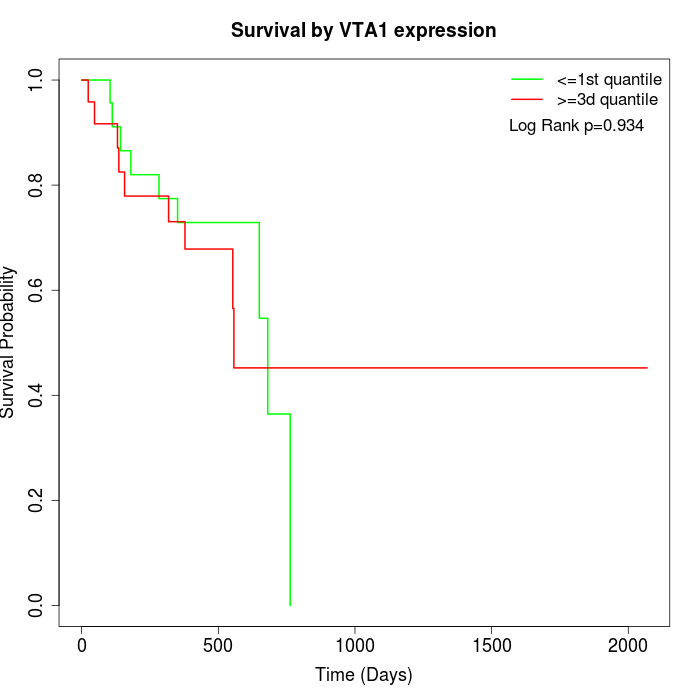 |
| GSE53622 | GSE53624 | TCGA |
Note: Click image to view full size file.
Copy number change of VTA1:
| Dataset | Gene | EntrezID | Gain | Loss | Normal | Detail |
|---|---|---|---|---|---|---|
| GSE15526 | VTA1 | 51534 | 2 | 5 | 23 | |
| GSE20123 | VTA1 | 51534 | 2 | 3 | 25 | |
| GSE43470 | VTA1 | 51534 | 5 | 0 | 38 | |
| GSE46452 | VTA1 | 51534 | 3 | 10 | 46 | |
| GSE47630 | VTA1 | 51534 | 9 | 4 | 27 | |
| GSE54993 | VTA1 | 51534 | 3 | 2 | 65 | |
| GSE54994 | VTA1 | 51534 | 8 | 8 | 37 | |
| GSE60625 | VTA1 | 51534 | 0 | 1 | 10 | |
| GSE74703 | VTA1 | 51534 | 4 | 0 | 32 | |
| GSE74704 | VTA1 | 51534 | 1 | 2 | 17 | |
| TCGA | VTA1 | 51534 | 11 | 19 | 66 |
Total number of gains: 48; Total number of losses: 54; Total Number of normals: 386.
Somatic mutations of VTA1:
Generating mutation plots.
Highly correlated genes for VTA1:
Showing top 20/341 corelated genes with mean PCC>0.5.
| Gene1 | Gene2 | Mean PCC | Num. Datasets | Num. PCC<0 | Num. PCC>0.5 |
|---|---|---|---|---|---|
| VTA1 | POLR3B | 0.692623 | 4 | 0 | 4 |
| VTA1 | MFAP3 | 0.67836 | 4 | 0 | 4 |
| VTA1 | MAP7 | 0.673112 | 8 | 0 | 6 |
| VTA1 | OSBPL10 | 0.669389 | 3 | 0 | 3 |
| VTA1 | ATG3 | 0.665899 | 4 | 0 | 3 |
| VTA1 | USP46-AS1 | 0.663351 | 3 | 0 | 3 |
| VTA1 | LY75 | 0.662721 | 3 | 0 | 3 |
| VTA1 | GPRC5A | 0.656452 | 3 | 0 | 3 |
| VTA1 | CAB39 | 0.656066 | 4 | 0 | 4 |
| VTA1 | CDKN2B | 0.655692 | 3 | 0 | 3 |
| VTA1 | CRYBG3 | 0.655318 | 4 | 0 | 4 |
| VTA1 | IL1A | 0.654409 | 3 | 0 | 3 |
| VTA1 | BROX | 0.651927 | 3 | 0 | 3 |
| VTA1 | HK2 | 0.647034 | 4 | 0 | 3 |
| VTA1 | TTC39B | 0.646404 | 4 | 0 | 4 |
| VTA1 | ZNF485 | 0.643908 | 3 | 0 | 3 |
| VTA1 | TAB2 | 0.643888 | 3 | 0 | 3 |
| VTA1 | SLC16A9 | 0.642055 | 3 | 0 | 3 |
| VTA1 | CTNNB1 | 0.641101 | 4 | 0 | 3 |
| VTA1 | NT5C2 | 0.637892 | 5 | 0 | 5 |
For details and further investigation, click here