| Full name: calcium binding protein 5 | Alias Symbol: CaBP3 | ||
| Type: protein-coding gene | Cytoband: 19q13.33 | ||
| Entrez ID: 56344 | HGNC ID: HGNC:13714 | Ensembl Gene: ENSG00000105507 | OMIM ID: 607315 |
Expression of CABP5:
| Dataset | Gene | EntrezID | Probe | Log2FC | Adj.pValue | Expression |
|---|---|---|---|---|---|---|
| GSE17351 | CABP5 | 56344 | 221160_s_at | -0.0455 | 0.8636 | |
| GSE20347 | CABP5 | 56344 | 221160_s_at | 0.0085 | 0.9006 | |
| GSE23400 | CABP5 | 56344 | 221160_s_at | -0.0878 | 0.0054 | |
| GSE26886 | CABP5 | 56344 | 221160_s_at | -0.0338 | 0.8202 | |
| GSE29001 | CABP5 | 56344 | 221160_s_at | 0.0367 | 0.8644 | |
| GSE38129 | CABP5 | 56344 | 221160_s_at | -0.0963 | 0.1122 | |
| GSE45670 | CABP5 | 56344 | 221160_s_at | 0.0582 | 0.5679 | |
| GSE53622 | CABP5 | 56344 | 9092 | -0.2854 | 0.0006 | |
| GSE53624 | CABP5 | 56344 | 9092 | -0.3570 | 0.0013 | |
| GSE63941 | CABP5 | 56344 | 221160_s_at | 0.0751 | 0.6222 | |
| GSE77861 | CABP5 | 56344 | 221160_s_at | -0.1043 | 0.3845 | |
| GSE97050 | CABP5 | 56344 | A_23_P21747 | -0.1267 | 0.5209 | |
| TCGA | CABP5 | 56344 | RNAseq | 1.1253 | 0.7141 |
Upregulated datasets: 0; Downregulated datasets: 0.
Survival by CABP5 expression:
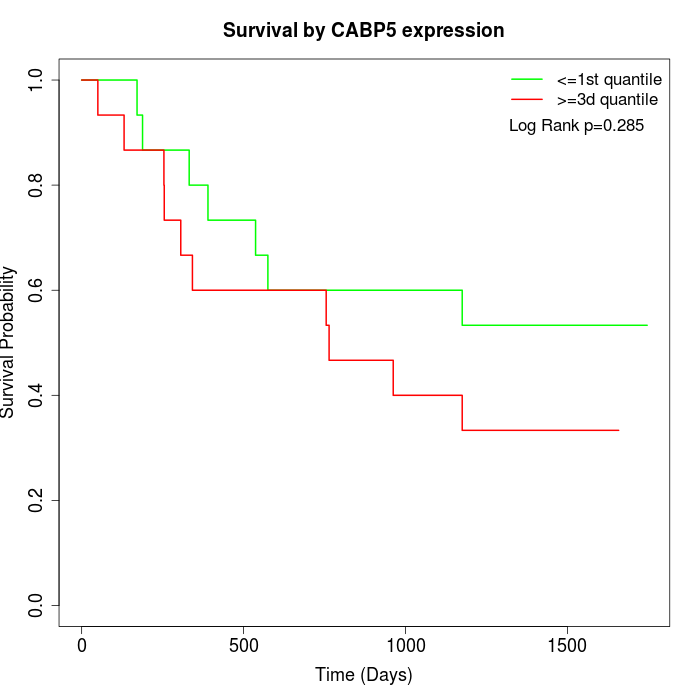 | 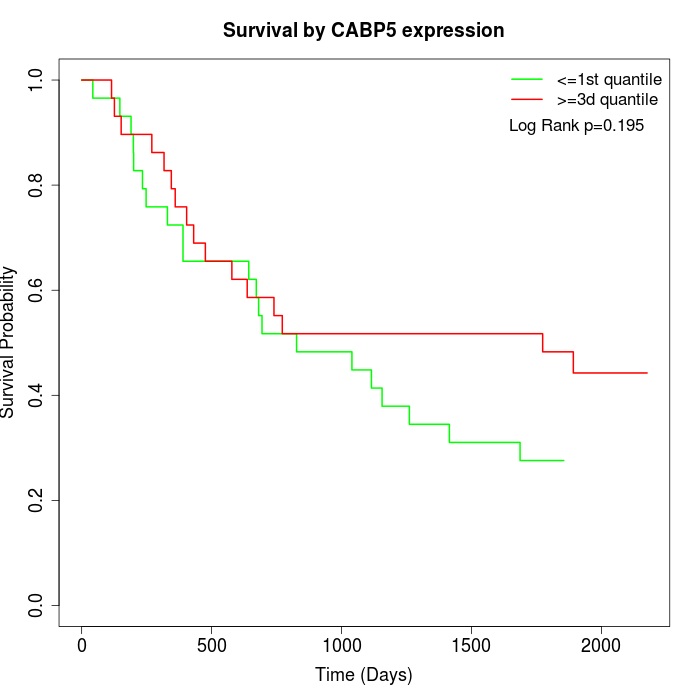 | 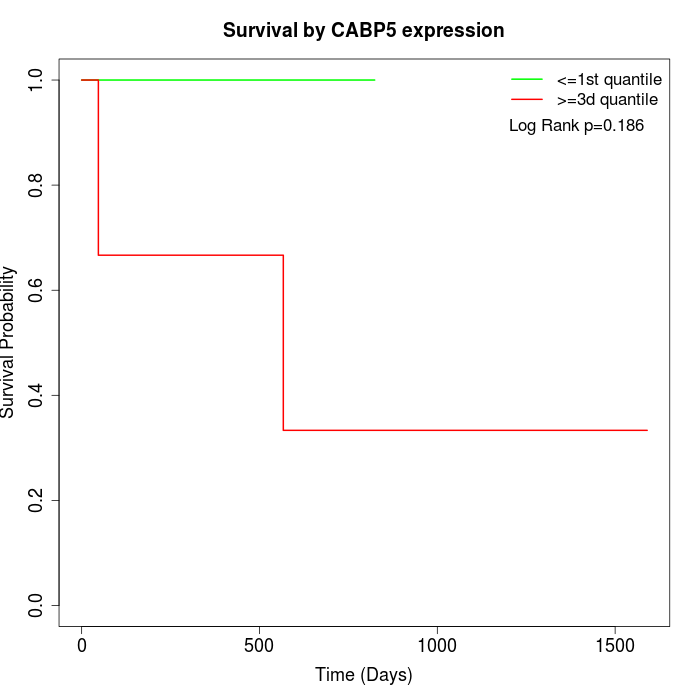 |
| GSE53622 | GSE53624 | TCGA |
Note: Click image to view full size file.
Copy number change of CABP5:
| Dataset | Gene | EntrezID | Gain | Loss | Normal | Detail |
|---|---|---|---|---|---|---|
| GSE15526 | CABP5 | 56344 | 4 | 4 | 22 | |
| GSE20123 | CABP5 | 56344 | 4 | 3 | 23 | |
| GSE43470 | CABP5 | 56344 | 3 | 10 | 30 | |
| GSE46452 | CABP5 | 56344 | 45 | 1 | 13 | |
| GSE47630 | CABP5 | 56344 | 8 | 7 | 25 | |
| GSE54993 | CABP5 | 56344 | 17 | 4 | 49 | |
| GSE54994 | CABP5 | 56344 | 4 | 14 | 35 | |
| GSE60625 | CABP5 | 56344 | 9 | 0 | 2 | |
| GSE74703 | CABP5 | 56344 | 3 | 7 | 26 | |
| GSE74704 | CABP5 | 56344 | 4 | 1 | 15 | |
| TCGA | CABP5 | 56344 | 15 | 19 | 62 |
Total number of gains: 116; Total number of losses: 70; Total Number of normals: 302.
Somatic mutations of CABP5:
Generating mutation plots.
Highly correlated genes for CABP5:
Showing top 20/920 corelated genes with mean PCC>0.5.
| Gene1 | Gene2 | Mean PCC | Num. Datasets | Num. PCC<0 | Num. PCC>0.5 |
|---|---|---|---|---|---|
| CABP5 | OR13G1 | 0.748628 | 3 | 0 | 3 |
| CABP5 | SMIM2 | 0.731578 | 3 | 0 | 3 |
| CABP5 | GDF7 | 0.713201 | 3 | 0 | 3 |
| CABP5 | OR4C3 | 0.707261 | 3 | 0 | 3 |
| CABP5 | FGF14 | 0.703845 | 3 | 0 | 3 |
| CABP5 | CLRN2 | 0.697736 | 3 | 0 | 3 |
| CABP5 | SFRP5 | 0.69072 | 3 | 0 | 3 |
| CABP5 | DCC | 0.686291 | 4 | 0 | 4 |
| CABP5 | FMR1NB | 0.685087 | 4 | 0 | 4 |
| CABP5 | ADRB3 | 0.680874 | 5 | 0 | 4 |
| CABP5 | OR10AD1 | 0.678994 | 3 | 0 | 3 |
| CABP5 | TPH2 | 0.673754 | 4 | 0 | 4 |
| CABP5 | SALL3 | 0.672706 | 3 | 0 | 3 |
| CABP5 | NOBOX | 0.670738 | 5 | 0 | 4 |
| CABP5 | LINC01260 | 0.663595 | 5 | 0 | 5 |
| CABP5 | RNF180 | 0.663578 | 4 | 0 | 4 |
| CABP5 | MLXIPL | 0.663462 | 4 | 0 | 4 |
| CABP5 | LRRC3C | 0.662689 | 3 | 0 | 3 |
| CABP5 | KDM8 | 0.660529 | 4 | 0 | 4 |
| CABP5 | OR51T1 | 0.660164 | 3 | 0 | 3 |
For details and further investigation, click here