| Full name: CD27 molecule | Alias Symbol: S152|Tp55 | ||
| Type: protein-coding gene | Cytoband: 12p13.31 | ||
| Entrez ID: 939 | HGNC ID: HGNC:11922 | Ensembl Gene: ENSG00000139193 | OMIM ID: 186711 |
Expression of CD27:
| Dataset | Gene | EntrezID | Probe | Log2FC | Adj.pValue | Expression |
|---|---|---|---|---|---|---|
| GSE17351 | CD27 | 939 | 206150_at | 0.2123 | 0.8995 | |
| GSE20347 | CD27 | 939 | 206150_at | 0.1472 | 0.3252 | |
| GSE23400 | CD27 | 939 | 206150_at | -0.1124 | 0.0347 | |
| GSE26886 | CD27 | 939 | 206150_at | -0.2718 | 0.2232 | |
| GSE29001 | CD27 | 939 | 206150_at | -0.0067 | 0.9771 | |
| GSE38129 | CD27 | 939 | 206150_at | 0.1117 | 0.6672 | |
| GSE45670 | CD27 | 939 | 206150_at | 0.0209 | 0.9439 | |
| GSE63941 | CD27 | 939 | 206150_at | 0.0664 | 0.7144 | |
| GSE77861 | CD27 | 939 | 206150_at | 0.0235 | 0.8815 | |
| GSE97050 | CD27 | 939 | A_23_P48088 | 0.5173 | 0.3399 | |
| SRP064894 | CD27 | 939 | RNAseq | 0.5478 | 0.1890 | |
| SRP133303 | CD27 | 939 | RNAseq | -0.0747 | 0.7664 | |
| SRP159526 | CD27 | 939 | RNAseq | -0.6286 | 0.5292 | |
| SRP219564 | CD27 | 939 | RNAseq | 0.9261 | 0.0311 | |
| TCGA | CD27 | 939 | RNAseq | -0.1043 | 0.6818 |
Upregulated datasets: 0; Downregulated datasets: 0.
Survival by CD27 expression:
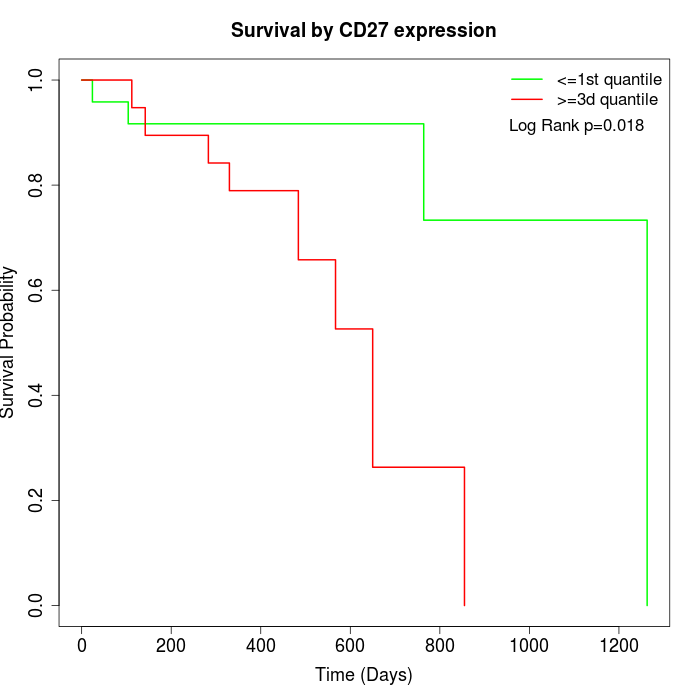 |
| TCGA |
Note: Click image to view full size file.
Copy number change of CD27:
| Dataset | Gene | EntrezID | Gain | Loss | Normal | Detail |
|---|---|---|---|---|---|---|
| GSE15526 | CD27 | 939 | 9 | 4 | 17 | |
| GSE20123 | CD27 | 939 | 9 | 4 | 17 | |
| GSE43470 | CD27 | 939 | 8 | 3 | 32 | |
| GSE46452 | CD27 | 939 | 10 | 1 | 48 | |
| GSE47630 | CD27 | 939 | 12 | 2 | 26 | |
| GSE54993 | CD27 | 939 | 1 | 10 | 59 | |
| GSE54994 | CD27 | 939 | 10 | 2 | 41 | |
| GSE60625 | CD27 | 939 | 0 | 1 | 10 | |
| GSE74703 | CD27 | 939 | 7 | 2 | 27 | |
| GSE74704 | CD27 | 939 | 5 | 3 | 12 | |
| TCGA | CD27 | 939 | 40 | 6 | 50 |
Total number of gains: 111; Total number of losses: 38; Total Number of normals: 339.
Somatic mutations of CD27:
Generating mutation plots.
Highly correlated genes for CD27:
Showing top 20/253 corelated genes with mean PCC>0.5.
| Gene1 | Gene2 | Mean PCC | Num. Datasets | Num. PCC<0 | Num. PCC>0.5 |
|---|---|---|---|---|---|
| CD27 | TNFRSF17 | 0.750059 | 8 | 0 | 8 |
| CD27 | WDFY4 | 0.736998 | 4 | 0 | 4 |
| CD27 | BTK | 0.727006 | 7 | 0 | 6 |
| CD27 | GPSM3 | 0.724204 | 8 | 0 | 7 |
| CD27 | MEI1 | 0.717199 | 3 | 0 | 3 |
| CD27 | PVRIG | 0.715799 | 8 | 0 | 8 |
| CD27 | ITGAL | 0.710413 | 8 | 0 | 8 |
| CD27 | MZB1 | 0.708847 | 8 | 0 | 7 |
| CD27 | LINC01215 | 0.70844 | 3 | 0 | 3 |
| CD27 | CD48 | 0.703387 | 9 | 0 | 8 |
| CD27 | CD180 | 0.699974 | 7 | 0 | 5 |
| CD27 | PTPRCAP | 0.698837 | 9 | 0 | 8 |
| CD27 | KLHL6 | 0.698091 | 5 | 0 | 4 |
| CD27 | ITK | 0.691152 | 8 | 0 | 7 |
| CD27 | IGK | 0.69045 | 6 | 0 | 5 |
| CD27 | NCKAP1L | 0.689646 | 8 | 0 | 8 |
| CD27 | SELL | 0.68649 | 7 | 0 | 7 |
| CD27 | SASH3 | 0.681131 | 10 | 0 | 10 |
| CD27 | CYTIP | 0.677583 | 6 | 0 | 5 |
| CD27 | CD79A | 0.676848 | 11 | 0 | 8 |
For details and further investigation, click here