| Full name: protein tyrosine phosphatase receptor type C associated protein | Alias Symbol: LPAP|CD45-AP | ||
| Type: protein-coding gene | Cytoband: 11q13.2 | ||
| Entrez ID: 5790 | HGNC ID: HGNC:9667 | Ensembl Gene: ENSG00000213402 | OMIM ID: 601577 |
Expression of PTPRCAP:
| Dataset | Gene | EntrezID | Probe | Log2FC | Adj.pValue | Expression |
|---|---|---|---|---|---|---|
| GSE17351 | PTPRCAP | 5790 | 204960_at | -0.0033 | 0.9982 | |
| GSE20347 | PTPRCAP | 5790 | 204960_at | -0.0340 | 0.8581 | |
| GSE23400 | PTPRCAP | 5790 | 204960_at | -0.1563 | 0.0043 | |
| GSE26886 | PTPRCAP | 5790 | 204960_at | 0.1885 | 0.2609 | |
| GSE29001 | PTPRCAP | 5790 | 204960_at | -0.1645 | 0.4067 | |
| GSE38129 | PTPRCAP | 5790 | 204960_at | -0.2469 | 0.3243 | |
| GSE45670 | PTPRCAP | 5790 | 204960_at | 0.0157 | 0.9369 | |
| GSE63941 | PTPRCAP | 5790 | 204960_at | 0.1771 | 0.2492 | |
| GSE77861 | PTPRCAP | 5790 | 204960_at | -0.1559 | 0.2670 | |
| GSE97050 | PTPRCAP | 5790 | A_33_P3295056 | 0.6787 | 0.2476 | |
| SRP064894 | PTPRCAP | 5790 | RNAseq | 0.7603 | 0.1841 | |
| SRP133303 | PTPRCAP | 5790 | RNAseq | -0.5440 | 0.1643 | |
| SRP159526 | PTPRCAP | 5790 | RNAseq | -1.5425 | 0.0749 | |
| SRP193095 | PTPRCAP | 5790 | RNAseq | -0.3705 | 0.3347 | |
| SRP219564 | PTPRCAP | 5790 | RNAseq | 0.6289 | 0.1521 | |
| TCGA | PTPRCAP | 5790 | RNAseq | -0.0867 | 0.6601 |
Upregulated datasets: 0; Downregulated datasets: 0.
Survival by PTPRCAP expression:
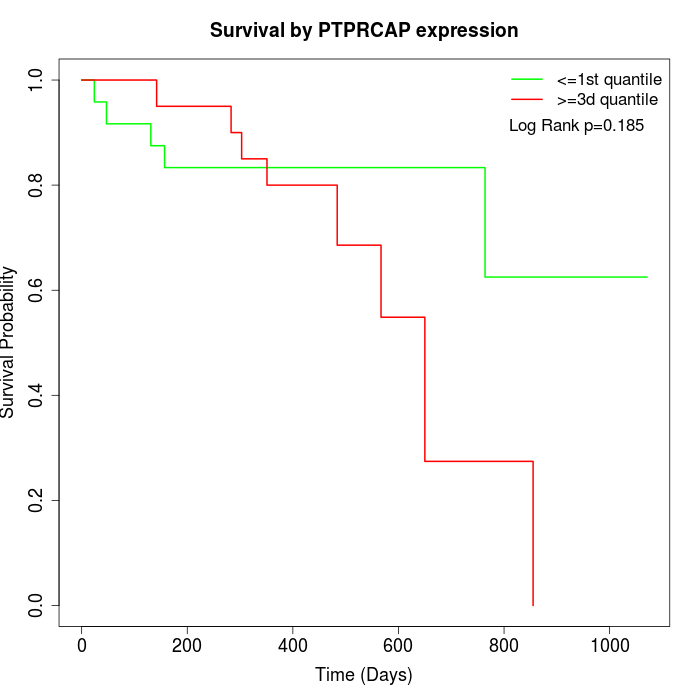 |
| TCGA |
Note: Click image to view full size file.
Copy number change of PTPRCAP:
| Dataset | Gene | EntrezID | Gain | Loss | Normal | Detail |
|---|---|---|---|---|---|---|
| GSE15526 | PTPRCAP | 5790 | 10 | 3 | 17 | |
| GSE20123 | PTPRCAP | 5790 | 10 | 3 | 17 | |
| GSE43470 | PTPRCAP | 5790 | 5 | 1 | 37 | |
| GSE46452 | PTPRCAP | 5790 | 14 | 3 | 42 | |
| GSE47630 | PTPRCAP | 5790 | 8 | 5 | 27 | |
| GSE54993 | PTPRCAP | 5790 | 3 | 1 | 66 | |
| GSE54994 | PTPRCAP | 5790 | 13 | 4 | 36 | |
| GSE60625 | PTPRCAP | 5790 | 0 | 3 | 8 | |
| GSE74703 | PTPRCAP | 5790 | 4 | 0 | 32 | |
| GSE74704 | PTPRCAP | 5790 | 8 | 1 | 11 | |
| TCGA | PTPRCAP | 5790 | 29 | 8 | 59 |
Total number of gains: 104; Total number of losses: 32; Total Number of normals: 352.
Somatic mutations of PTPRCAP:
Generating mutation plots.
Highly correlated genes for PTPRCAP:
Showing top 20/473 corelated genes with mean PCC>0.5.
| Gene1 | Gene2 | Mean PCC | Num. Datasets | Num. PCC<0 | Num. PCC>0.5 |
|---|---|---|---|---|---|
| PTPRCAP | POU1F1 | 0.78313 | 3 | 0 | 3 |
| PTPRCAP | ABCA4 | 0.762302 | 3 | 0 | 3 |
| PTPRCAP | TBC1D10C | 0.761663 | 6 | 0 | 5 |
| PTPRCAP | TONSL | 0.739465 | 3 | 0 | 3 |
| PTPRCAP | AIRE | 0.739292 | 3 | 0 | 3 |
| PTPRCAP | PAX7 | 0.738647 | 3 | 0 | 3 |
| PTPRCAP | SLC16A11 | 0.731866 | 3 | 0 | 3 |
| PTPRCAP | RHBG | 0.728353 | 3 | 0 | 3 |
| PTPRCAP | FMNL1 | 0.725244 | 5 | 0 | 5 |
| PTPRCAP | PTGER1 | 0.721287 | 4 | 0 | 4 |
| PTPRCAP | GPSM3 | 0.720908 | 9 | 0 | 7 |
| PTPRCAP | IKZF3 | 0.720677 | 4 | 0 | 4 |
| PTPRCAP | WAS | 0.717916 | 9 | 0 | 8 |
| PTPRCAP | PSPN | 0.711868 | 3 | 0 | 3 |
| PTPRCAP | DNAI1 | 0.705264 | 3 | 0 | 3 |
| PTPRCAP | P2RX5 | 0.705227 | 4 | 0 | 3 |
| PTPRCAP | SLC6A3 | 0.702636 | 3 | 0 | 3 |
| PTPRCAP | ZGLP1 | 0.702298 | 3 | 0 | 3 |
| PTPRCAP | RAB3IL1 | 0.699603 | 3 | 0 | 3 |
| PTPRCAP | AKNA | 0.698969 | 5 | 0 | 4 |
For details and further investigation, click here