| Full name: calcium and integrin binding 1 | Alias Symbol: SIP2-28|CIB|KIP | ||
| Type: protein-coding gene | Cytoband: 15q26.1 | ||
| Entrez ID: 10519 | HGNC ID: HGNC:16920 | Ensembl Gene: ENSG00000185043 | OMIM ID: 602293 |
Expression of CIB1:
| Dataset | Gene | EntrezID | Probe | Log2FC | Adj.pValue | Expression |
|---|---|---|---|---|---|---|
| GSE17351 | CIB1 | 10519 | 201953_at | 0.0995 | 0.9014 | |
| GSE20347 | CIB1 | 10519 | 201953_at | 0.0057 | 0.9882 | |
| GSE23400 | CIB1 | 10519 | 201953_at | -0.0147 | 0.8999 | |
| GSE26886 | CIB1 | 10519 | 201953_at | -0.3810 | 0.1014 | |
| GSE29001 | CIB1 | 10519 | 201953_at | -0.4962 | 0.4027 | |
| GSE38129 | CIB1 | 10519 | 201953_at | 0.1320 | 0.5728 | |
| GSE45670 | CIB1 | 10519 | 201953_at | 0.2963 | 0.1477 | |
| GSE53622 | CIB1 | 10519 | 13572 | -0.4364 | 0.0002 | |
| GSE53624 | CIB1 | 10519 | 13572 | -0.3757 | 0.0000 | |
| GSE63941 | CIB1 | 10519 | 201953_at | 0.5301 | 0.3587 | |
| GSE77861 | CIB1 | 10519 | 201953_at | -0.0918 | 0.7179 | |
| GSE97050 | CIB1 | 10519 | A_24_P44514 | 0.3165 | 0.3684 | |
| SRP007169 | CIB1 | 10519 | RNAseq | -0.9416 | 0.0026 | |
| SRP008496 | CIB1 | 10519 | RNAseq | -1.0095 | 0.0000 | |
| SRP064894 | CIB1 | 10519 | RNAseq | 0.2898 | 0.3643 | |
| SRP133303 | CIB1 | 10519 | RNAseq | -0.0460 | 0.8439 | |
| SRP159526 | CIB1 | 10519 | RNAseq | -0.7038 | 0.0516 | |
| SRP193095 | CIB1 | 10519 | RNAseq | -0.3082 | 0.0363 | |
| SRP219564 | CIB1 | 10519 | RNAseq | 0.1070 | 0.7402 | |
| TCGA | CIB1 | 10519 | RNAseq | 0.0329 | 0.6150 |
Upregulated datasets: 0; Downregulated datasets: 1.
Survival by CIB1 expression:
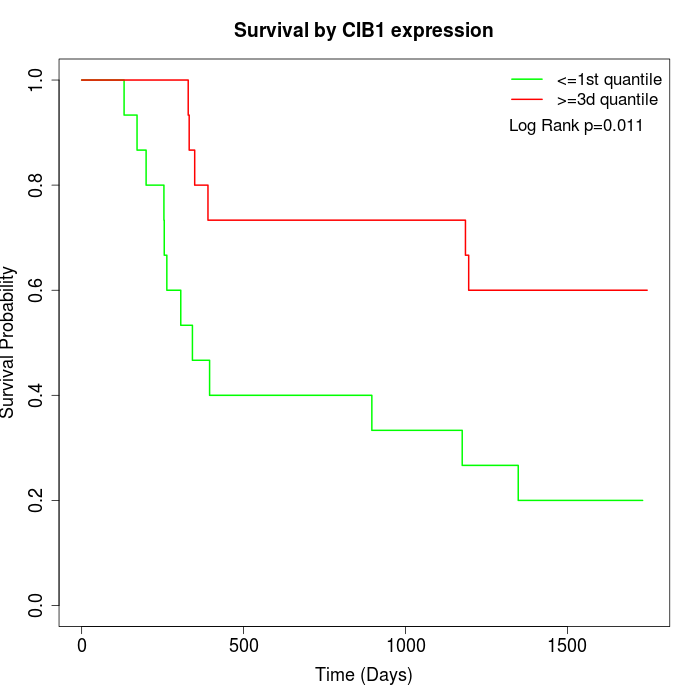 |  | 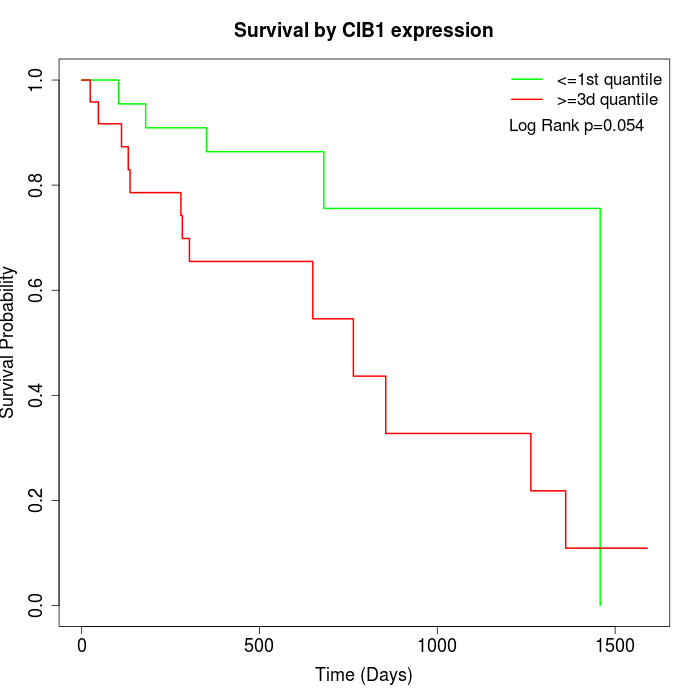 |
| GSE53622 | GSE53624 | TCGA |
Note: Click image to view full size file.
Copy number change of CIB1:
| Dataset | Gene | EntrezID | Gain | Loss | Normal | Detail |
|---|---|---|---|---|---|---|
| GSE15526 | CIB1 | 10519 | 9 | 2 | 19 | |
| GSE20123 | CIB1 | 10519 | 9 | 2 | 19 | |
| GSE43470 | CIB1 | 10519 | 5 | 5 | 33 | |
| GSE46452 | CIB1 | 10519 | 3 | 7 | 49 | |
| GSE47630 | CIB1 | 10519 | 8 | 11 | 21 | |
| GSE54993 | CIB1 | 10519 | 4 | 6 | 60 | |
| GSE54994 | CIB1 | 10519 | 7 | 6 | 40 | |
| GSE60625 | CIB1 | 10519 | 4 | 0 | 7 | |
| GSE74703 | CIB1 | 10519 | 4 | 4 | 28 | |
| GSE74704 | CIB1 | 10519 | 5 | 1 | 14 | |
| TCGA | CIB1 | 10519 | 18 | 12 | 66 |
Total number of gains: 76; Total number of losses: 56; Total Number of normals: 356.
Somatic mutations of CIB1:
Generating mutation plots.
Highly correlated genes for CIB1:
Showing top 20/369 corelated genes with mean PCC>0.5.
| Gene1 | Gene2 | Mean PCC | Num. Datasets | Num. PCC<0 | Num. PCC>0.5 |
|---|---|---|---|---|---|
| CIB1 | ARPC1A | 0.834211 | 3 | 0 | 3 |
| CIB1 | XRCC6 | 0.82443 | 3 | 0 | 3 |
| CIB1 | GLRX3 | 0.821931 | 3 | 0 | 3 |
| CIB1 | CHCHD2 | 0.816596 | 3 | 0 | 3 |
| CIB1 | CDYL | 0.802383 | 3 | 0 | 3 |
| CIB1 | FASTKD2 | 0.791727 | 3 | 0 | 3 |
| CIB1 | SWAP70 | 0.789469 | 3 | 0 | 3 |
| CIB1 | YIF1A | 0.773688 | 3 | 0 | 3 |
| CIB1 | UFSP2 | 0.766344 | 3 | 0 | 3 |
| CIB1 | EIF4A3 | 0.765081 | 4 | 0 | 4 |
| CIB1 | ZSCAN20 | 0.755886 | 3 | 0 | 3 |
| CIB1 | GALNT7 | 0.753033 | 3 | 0 | 3 |
| CIB1 | LSM12 | 0.752633 | 3 | 0 | 3 |
| CIB1 | NDUFA13 | 0.746747 | 3 | 0 | 3 |
| CIB1 | PSMD9 | 0.744426 | 4 | 0 | 3 |
| CIB1 | LAPTM4A | 0.741097 | 3 | 0 | 3 |
| CIB1 | TMEM208 | 0.73731 | 3 | 0 | 3 |
| CIB1 | EMG1 | 0.732399 | 3 | 0 | 3 |
| CIB1 | INTS9 | 0.725259 | 3 | 0 | 3 |
| CIB1 | PAWR | 0.71984 | 3 | 0 | 3 |
For details and further investigation, click here