| Full name: CTD small phosphatase 2 | Alias Symbol: OS4|SCP2|PSR2 | ||
| Type: protein-coding gene | Cytoband: 12q14.1 | ||
| Entrez ID: 10106 | HGNC ID: HGNC:17077 | Ensembl Gene: ENSG00000175215 | OMIM ID: 608711 |
Expression of CTDSP2:
| Dataset | Gene | EntrezID | Probe | Log2FC | Adj.pValue | Expression |
|---|---|---|---|---|---|---|
| GSE17351 | CTDSP2 | 10106 | 203445_s_at | 0.1230 | 0.8214 | |
| GSE20347 | CTDSP2 | 10106 | 203445_s_at | 0.2828 | 0.1027 | |
| GSE23400 | CTDSP2 | 10106 | 203445_s_at | 0.1421 | 0.0255 | |
| GSE26886 | CTDSP2 | 10106 | 203445_s_at | -0.0921 | 0.6307 | |
| GSE29001 | CTDSP2 | 10106 | 203445_s_at | 0.0566 | 0.8834 | |
| GSE38129 | CTDSP2 | 10106 | 203445_s_at | 0.2584 | 0.0525 | |
| GSE45670 | CTDSP2 | 10106 | 203445_s_at | -0.1679 | 0.1625 | |
| GSE53622 | CTDSP2 | 10106 | 58508 | 0.0903 | 0.1338 | |
| GSE53624 | CTDSP2 | 10106 | 58508 | 0.3000 | 0.0000 | |
| GSE63941 | CTDSP2 | 10106 | 203445_s_at | 0.0501 | 0.9160 | |
| GSE77861 | CTDSP2 | 10106 | 203445_s_at | 0.2665 | 0.1737 | |
| GSE97050 | CTDSP2 | 10106 | A_33_P3267280 | 0.1228 | 0.5894 | |
| SRP007169 | CTDSP2 | 10106 | RNAseq | -0.3937 | 0.1623 | |
| SRP008496 | CTDSP2 | 10106 | RNAseq | -0.3107 | 0.0075 | |
| SRP064894 | CTDSP2 | 10106 | RNAseq | 0.0255 | 0.8789 | |
| SRP133303 | CTDSP2 | 10106 | RNAseq | 0.2122 | 0.0294 | |
| SRP159526 | CTDSP2 | 10106 | RNAseq | 0.1549 | 0.4024 | |
| SRP193095 | CTDSP2 | 10106 | RNAseq | 0.3823 | 0.0239 | |
| SRP219564 | CTDSP2 | 10106 | RNAseq | -0.2210 | 0.4911 | |
| TCGA | CTDSP2 | 10106 | RNAseq | -0.1257 | 0.0011 |
Upregulated datasets: 0; Downregulated datasets: 0.
Survival by CTDSP2 expression:
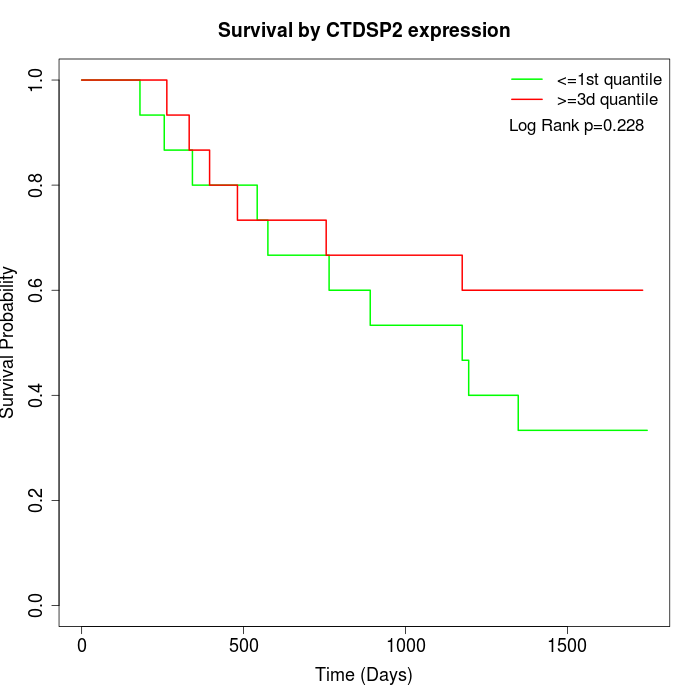 | 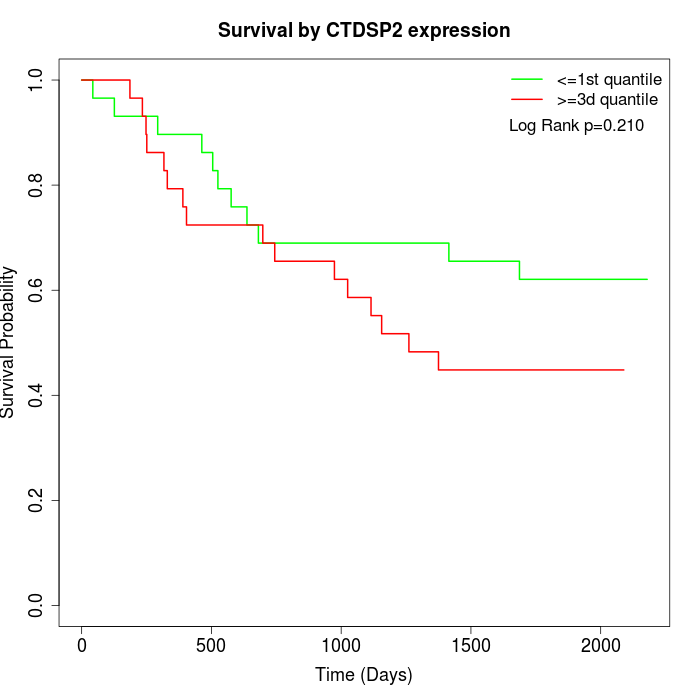 | 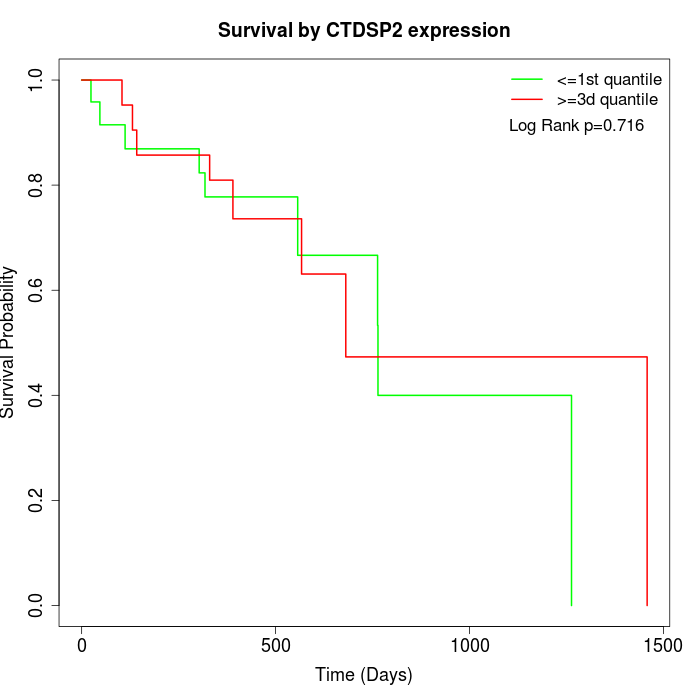 |
| GSE53622 | GSE53624 | TCGA |
Note: Click image to view full size file.
Copy number change of CTDSP2:
| Dataset | Gene | EntrezID | Gain | Loss | Normal | Detail |
|---|---|---|---|---|---|---|
| GSE15526 | CTDSP2 | 10106 | 7 | 0 | 23 | |
| GSE20123 | CTDSP2 | 10106 | 7 | 0 | 23 | |
| GSE43470 | CTDSP2 | 10106 | 2 | 0 | 41 | |
| GSE46452 | CTDSP2 | 10106 | 8 | 1 | 50 | |
| GSE47630 | CTDSP2 | 10106 | 10 | 2 | 28 | |
| GSE54993 | CTDSP2 | 10106 | 0 | 5 | 65 | |
| GSE54994 | CTDSP2 | 10106 | 4 | 1 | 48 | |
| GSE60625 | CTDSP2 | 10106 | 0 | 0 | 11 | |
| GSE74703 | CTDSP2 | 10106 | 2 | 0 | 34 | |
| GSE74704 | CTDSP2 | 10106 | 5 | 0 | 15 | |
| TCGA | CTDSP2 | 10106 | 15 | 10 | 71 |
Total number of gains: 60; Total number of losses: 19; Total Number of normals: 409.
Somatic mutations of CTDSP2:
Generating mutation plots.
Highly correlated genes for CTDSP2:
Showing top 20/427 corelated genes with mean PCC>0.5.
| Gene1 | Gene2 | Mean PCC | Num. Datasets | Num. PCC<0 | Num. PCC>0.5 |
|---|---|---|---|---|---|
| CTDSP2 | GIMAP1 | 0.789053 | 3 | 0 | 3 |
| CTDSP2 | COMMD3 | 0.783156 | 3 | 0 | 3 |
| CTDSP2 | GLCCI1 | 0.775267 | 3 | 0 | 3 |
| CTDSP2 | DDB1 | 0.751862 | 3 | 0 | 3 |
| CTDSP2 | PIM2 | 0.740879 | 3 | 0 | 3 |
| CTDSP2 | FICD | 0.717728 | 3 | 0 | 3 |
| CTDSP2 | TP53I13 | 0.708335 | 3 | 0 | 3 |
| CTDSP2 | ZNF627 | 0.706758 | 3 | 0 | 3 |
| CTDSP2 | MIEN1 | 0.702261 | 3 | 0 | 3 |
| CTDSP2 | ABHD2 | 0.699412 | 4 | 0 | 3 |
| CTDSP2 | NHS | 0.693498 | 3 | 0 | 3 |
| CTDSP2 | SNAPIN | 0.69174 | 3 | 0 | 3 |
| CTDSP2 | ZNF664 | 0.68961 | 4 | 0 | 3 |
| CTDSP2 | RPS5 | 0.6814 | 3 | 0 | 3 |
| CTDSP2 | SND1 | 0.67623 | 4 | 0 | 4 |
| CTDSP2 | TMED8 | 0.675405 | 3 | 0 | 3 |
| CTDSP2 | GCLC | 0.675166 | 4 | 0 | 4 |
| CTDSP2 | PPP1R35 | 0.673323 | 3 | 0 | 3 |
| CTDSP2 | IRF2 | 0.673159 | 4 | 0 | 3 |
| CTDSP2 | CRTC2 | 0.66997 | 3 | 0 | 3 |
For details and further investigation, click here