| Full name: damage specific DNA binding protein 1 | Alias Symbol: | ||
| Type: protein-coding gene | Cytoband: 11q12.2 | ||
| Entrez ID: 1642 | HGNC ID: HGNC:2717 | Ensembl Gene: ENSG00000167986 | OMIM ID: 600045 |
| Related drugs: LENALIDOMIDE, POMALIDOMIDE, THALIDOMIDE... [more] | |||
Screen Evidence:
| |||
Expression of DDB1:
| Dataset | Gene | EntrezID | Probe | Log2FC | Adj.pValue | Expression |
|---|---|---|---|---|---|---|
| GSE17351 | DDB1 | 1642 | 208619_at | 0.2827 | 0.3408 | |
| GSE20347 | DDB1 | 1642 | 208619_at | 0.2343 | 0.0241 | |
| GSE23400 | DDB1 | 1642 | 208619_at | 0.1755 | 0.0002 | |
| GSE26886 | DDB1 | 1642 | 208619_at | 0.3811 | 0.0117 | |
| GSE29001 | DDB1 | 1642 | 208619_at | -0.0507 | 0.7737 | |
| GSE38129 | DDB1 | 1642 | 208619_at | 0.2216 | 0.0007 | |
| GSE45670 | DDB1 | 1642 | 208619_at | 0.1585 | 0.1473 | |
| GSE53622 | DDB1 | 1642 | 29130 | 0.0036 | 0.9480 | |
| GSE53624 | DDB1 | 1642 | 29130 | 0.2875 | 0.0000 | |
| GSE63941 | DDB1 | 1642 | 208619_at | -0.0048 | 0.9915 | |
| GSE77861 | DDB1 | 1642 | 208619_at | 0.4421 | 0.0159 | |
| GSE97050 | DDB1 | 1642 | A_23_P258246 | -0.0930 | 0.6701 | |
| SRP007169 | DDB1 | 1642 | RNAseq | 1.0189 | 0.0019 | |
| SRP008496 | DDB1 | 1642 | RNAseq | 0.8900 | 0.0000 | |
| SRP064894 | DDB1 | 1642 | RNAseq | 0.1438 | 0.1113 | |
| SRP133303 | DDB1 | 1642 | RNAseq | 0.1158 | 0.4400 | |
| SRP159526 | DDB1 | 1642 | RNAseq | 0.4500 | 0.0064 | |
| SRP193095 | DDB1 | 1642 | RNAseq | 0.1864 | 0.0701 | |
| SRP219564 | DDB1 | 1642 | RNAseq | 0.3398 | 0.2280 | |
| TCGA | DDB1 | 1642 | RNAseq | -0.0147 | 0.7096 |
Upregulated datasets: 1; Downregulated datasets: 0.
Survival by DDB1 expression:
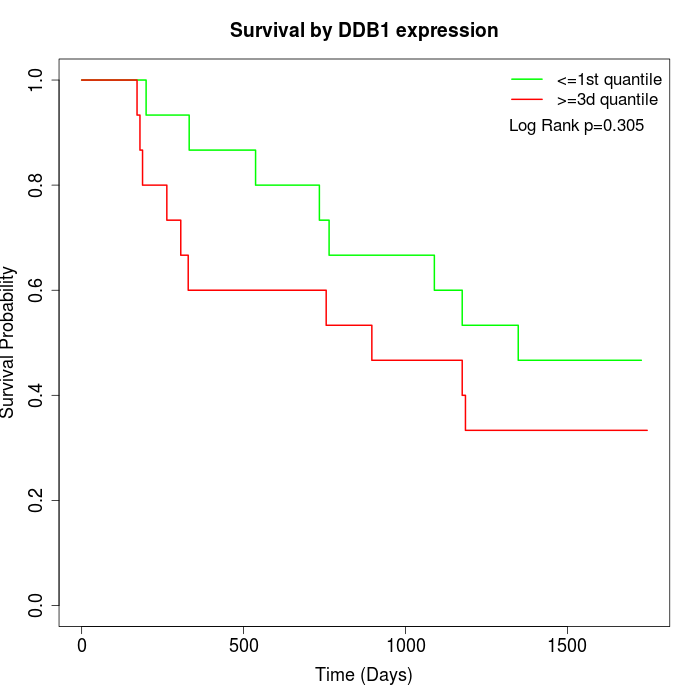 | 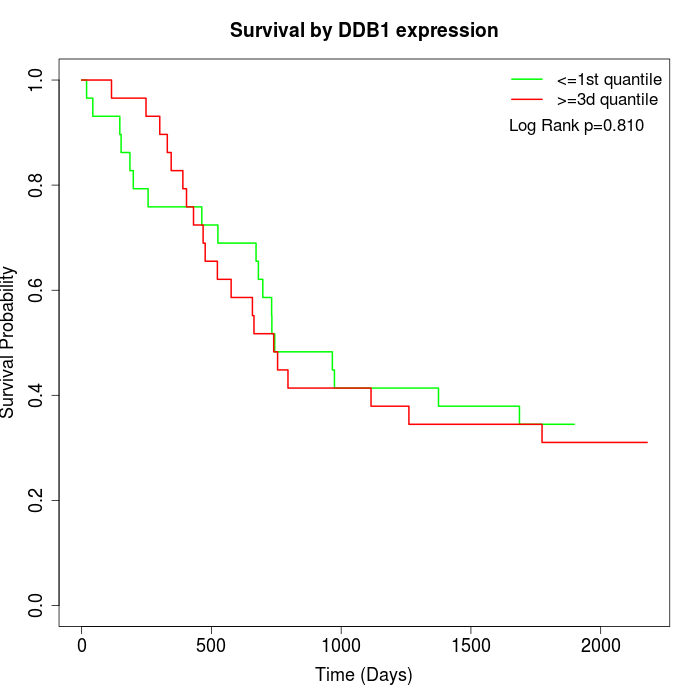 | 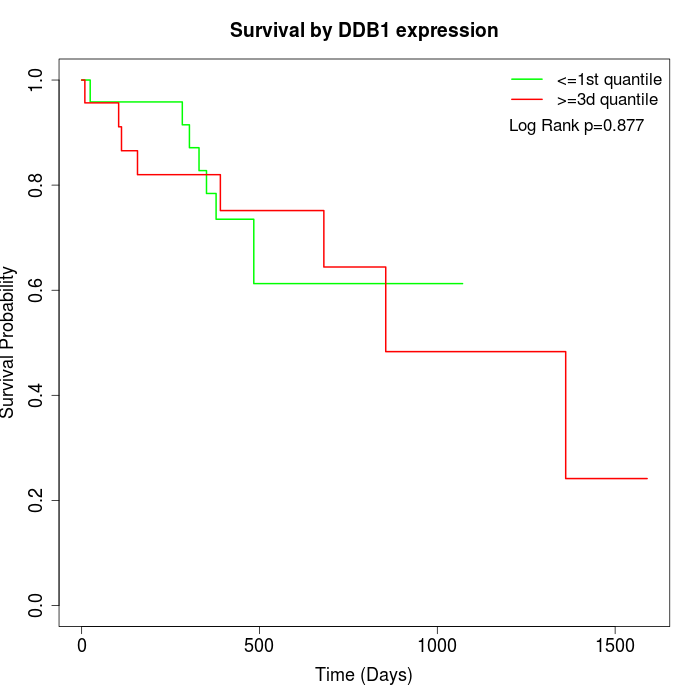 |
| GSE53622 | GSE53624 | TCGA |
Note: Click image to view full size file.
Copy number change of DDB1:
| Dataset | Gene | EntrezID | Gain | Loss | Normal | Detail |
|---|---|---|---|---|---|---|
| GSE15526 | DDB1 | 1642 | 4 | 5 | 21 | |
| GSE20123 | DDB1 | 1642 | 4 | 5 | 21 | |
| GSE43470 | DDB1 | 1642 | 2 | 6 | 35 | |
| GSE46452 | DDB1 | 1642 | 8 | 4 | 47 | |
| GSE47630 | DDB1 | 1642 | 3 | 8 | 29 | |
| GSE54993 | DDB1 | 1642 | 3 | 0 | 67 | |
| GSE54994 | DDB1 | 1642 | 5 | 5 | 43 | |
| GSE60625 | DDB1 | 1642 | 0 | 3 | 8 | |
| GSE74703 | DDB1 | 1642 | 2 | 3 | 31 | |
| GSE74704 | DDB1 | 1642 | 3 | 3 | 14 | |
| TCGA | DDB1 | 1642 | 15 | 10 | 71 |
Total number of gains: 49; Total number of losses: 52; Total Number of normals: 387.
Somatic mutations of DDB1:
Generating mutation plots.
Highly correlated genes for DDB1:
Showing top 20/791 corelated genes with mean PCC>0.5.
| Gene1 | Gene2 | Mean PCC | Num. Datasets | Num. PCC<0 | Num. PCC>0.5 |
|---|---|---|---|---|---|
| DDB1 | SMCR8 | 0.832007 | 3 | 0 | 3 |
| DDB1 | MSTO1 | 0.82851 | 3 | 0 | 3 |
| DDB1 | GOT2 | 0.825613 | 3 | 0 | 3 |
| DDB1 | ZHX2 | 0.818945 | 3 | 0 | 3 |
| DDB1 | UBQLN4 | 0.812506 | 3 | 0 | 3 |
| DDB1 | MRPL38 | 0.809819 | 3 | 0 | 3 |
| DDB1 | WIZ | 0.80782 | 3 | 0 | 3 |
| DDB1 | IRF2BPL | 0.785621 | 3 | 0 | 3 |
| DDB1 | OGDH | 0.784339 | 3 | 0 | 3 |
| DDB1 | TLK2 | 0.782729 | 3 | 0 | 3 |
| DDB1 | PIP4K2C | 0.781535 | 3 | 0 | 3 |
| DDB1 | TAF1C | 0.772632 | 3 | 0 | 3 |
| DDB1 | KLHL5 | 0.753006 | 3 | 0 | 3 |
| DDB1 | KRTCAP2 | 0.752831 | 3 | 0 | 3 |
| DDB1 | CTDSP2 | 0.751862 | 3 | 0 | 3 |
| DDB1 | SURF6 | 0.751367 | 3 | 0 | 3 |
| DDB1 | CBLL1 | 0.749881 | 3 | 0 | 3 |
| DDB1 | ZNF343 | 0.74573 | 3 | 0 | 3 |
| DDB1 | C12orf57 | 0.742502 | 3 | 0 | 3 |
| DDB1 | ADO | 0.738491 | 3 | 0 | 3 |
For details and further investigation, click here