| Full name: GTPase, IMAP family member 1 | Alias Symbol: HIMAP1|IMAP38|IMAP1|IAN2 | ||
| Type: protein-coding gene | Cytoband: 7q36.1 | ||
| Entrez ID: 170575 | HGNC ID: HGNC:23237 | Ensembl Gene: ENSG00000213203 | OMIM ID: 608084 |
Expression of GIMAP1:
| Dataset | Gene | EntrezID | Probe | Log2FC | Adj.pValue | Expression |
|---|---|---|---|---|---|---|
| GSE17351 | GIMAP1 | 170575 | 1552315_at | -0.0562 | 0.9269 | |
| GSE26886 | GIMAP1 | 170575 | 1552315_at | -0.3530 | 0.2232 | |
| GSE45670 | GIMAP1 | 170575 | 1552315_at | -0.5930 | 0.0106 | |
| GSE53622 | GIMAP1 | 170575 | 62749 | -0.8746 | 0.0000 | |
| GSE53624 | GIMAP1 | 170575 | 62749 | -0.6924 | 0.0000 | |
| GSE63941 | GIMAP1 | 170575 | 1552315_at | 0.0824 | 0.6844 | |
| GSE77861 | GIMAP1 | 170575 | 1552315_at | -0.0616 | 0.5638 | |
| GSE97050 | GIMAP1 | 170575 | A_23_P427023 | -0.0871 | 0.8706 | |
| SRP064894 | GIMAP1 | 170575 | RNAseq | 0.1190 | 0.7711 | |
| SRP133303 | GIMAP1 | 170575 | RNAseq | -1.0132 | 0.0001 | |
| SRP159526 | GIMAP1 | 170575 | RNAseq | -0.7515 | 0.1248 | |
| SRP193095 | GIMAP1 | 170575 | RNAseq | -0.2797 | 0.1211 | |
| SRP219564 | GIMAP1 | 170575 | RNAseq | -0.0503 | 0.9188 | |
| TCGA | GIMAP1 | 170575 | RNAseq | -0.5895 | 0.0031 |
Upregulated datasets: 0; Downregulated datasets: 1.
Survival by GIMAP1 expression:
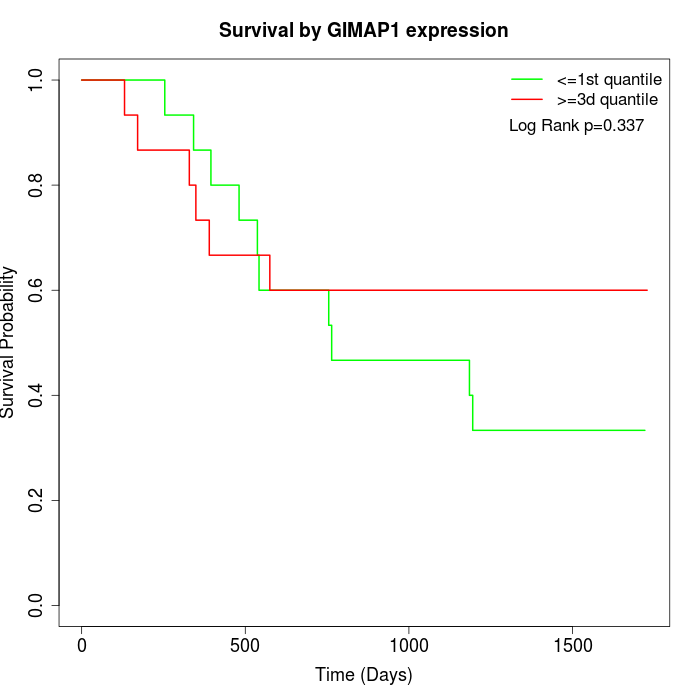 | 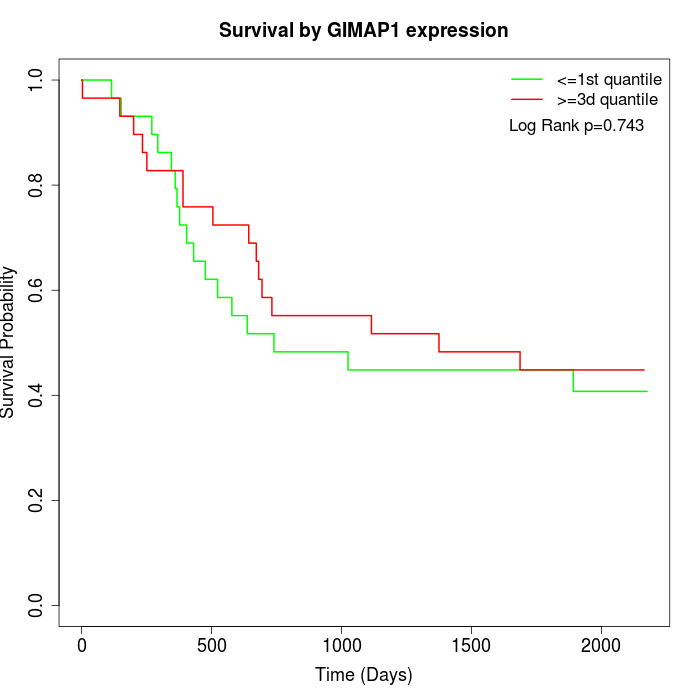 | 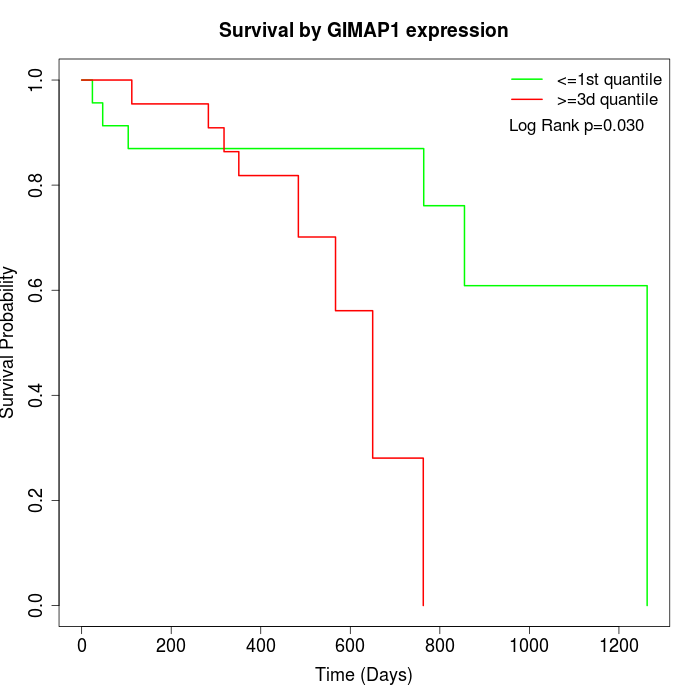 |
| GSE53622 | GSE53624 | TCGA |
Note: Click image to view full size file.
Copy number change of GIMAP1:
| Dataset | Gene | EntrezID | Gain | Loss | Normal | Detail |
|---|---|---|---|---|---|---|
| GSE15526 | GIMAP1 | 170575 | 2 | 4 | 24 | |
| GSE20123 | GIMAP1 | 170575 | 2 | 4 | 24 | |
| GSE43470 | GIMAP1 | 170575 | 2 | 5 | 36 | |
| GSE46452 | GIMAP1 | 170575 | 7 | 2 | 50 | |
| GSE47630 | GIMAP1 | 170575 | 5 | 9 | 26 | |
| GSE54993 | GIMAP1 | 170575 | 3 | 3 | 64 | |
| GSE54994 | GIMAP1 | 170575 | 5 | 8 | 40 | |
| GSE60625 | GIMAP1 | 170575 | 0 | 0 | 11 | |
| GSE74703 | GIMAP1 | 170575 | 2 | 4 | 30 | |
| GSE74704 | GIMAP1 | 170575 | 1 | 4 | 15 | |
| TCGA | GIMAP1 | 170575 | 25 | 26 | 45 |
Total number of gains: 54; Total number of losses: 69; Total Number of normals: 365.
Somatic mutations of GIMAP1:
Generating mutation plots.
Highly correlated genes for GIMAP1:
Showing top 20/635 corelated genes with mean PCC>0.5.
| Gene1 | Gene2 | Mean PCC | Num. Datasets | Num. PCC<0 | Num. PCC>0.5 |
|---|---|---|---|---|---|
| GIMAP1 | GIMAP6 | 0.847107 | 7 | 0 | 7 |
| GIMAP1 | GIMAP5 | 0.818436 | 4 | 0 | 3 |
| GIMAP1 | FLI1 | 0.806892 | 7 | 0 | 7 |
| GIMAP1 | TNFSF8 | 0.793134 | 4 | 0 | 4 |
| GIMAP1 | PHACTR1 | 0.789618 | 4 | 0 | 4 |
| GIMAP1 | CTDSP2 | 0.789053 | 3 | 0 | 3 |
| GIMAP1 | MS4A6A | 0.785286 | 7 | 0 | 7 |
| GIMAP1 | PIP4K2A | 0.779378 | 3 | 0 | 3 |
| GIMAP1 | ARHGAP15 | 0.779264 | 4 | 0 | 4 |
| GIMAP1 | MPEG1 | 0.769274 | 6 | 0 | 6 |
| GIMAP1 | CD79B | 0.76754 | 5 | 0 | 5 |
| GIMAP1 | ST3GAL5 | 0.766975 | 3 | 0 | 3 |
| GIMAP1 | RCSD1 | 0.76456 | 7 | 0 | 7 |
| GIMAP1 | GAB3 | 0.763307 | 6 | 0 | 5 |
| GIMAP1 | RAB39B | 0.762377 | 4 | 0 | 4 |
| GIMAP1 | TFPI | 0.757732 | 5 | 0 | 5 |
| GIMAP1 | IRF8 | 0.752674 | 7 | 0 | 7 |
| GIMAP1 | PDE7B | 0.749603 | 5 | 0 | 5 |
| GIMAP1 | TNFSF12 | 0.747653 | 4 | 0 | 4 |
| GIMAP1 | RBP5 | 0.742411 | 3 | 0 | 3 |
For details and further investigation, click here