| Full name: cytotoxic T-lymphocyte associated protein 4 | Alias Symbol: CD152|CD|GSE|CTLA-4 | ||
| Type: protein-coding gene | Cytoband: 2q33.2 | ||
| Entrez ID: 1493 | HGNC ID: HGNC:2505 | Ensembl Gene: ENSG00000163599 | OMIM ID: 123890 |
| Related drugs: ALCOHOL, ANTIBIOTIC, ATEZOLIZUMAB, ATPGAMMAS, BLEOMYCIN (CHEMBL3039590), IPILIMUMAB, METHIMAZOLE, PHORBOL MYRISTATE ACETATE, RIZATRIPTAN, SIROLIMUS... [more] | |||
CTLA4 involved pathways:
| KEGG pathway | Description | View |
|---|---|---|
| hsa04660 | T cell receptor signaling pathway |
Expression of CTLA4:
| Dataset | Gene | EntrezID | Probe | Log2FC | Adj.pValue | Expression |
|---|---|---|---|---|---|---|
| GSE17351 | CTLA4 | 1493 | 221331_x_at | 0.1265 | 0.8485 | |
| GSE20347 | CTLA4 | 1493 | 221331_x_at | 0.0524 | 0.6654 | |
| GSE23400 | CTLA4 | 1493 | 221331_x_at | -0.0085 | 0.8568 | |
| GSE26886 | CTLA4 | 1493 | 234895_at | -0.2587 | 0.0434 | |
| GSE29001 | CTLA4 | 1493 | 221331_x_at | 0.0021 | 0.9923 | |
| GSE38129 | CTLA4 | 1493 | 221331_x_at | 0.0673 | 0.6015 | |
| GSE45670 | CTLA4 | 1493 | 234895_at | 0.1550 | 0.1100 | |
| GSE53622 | CTLA4 | 1493 | 18637 | 0.8354 | 0.0000 | |
| GSE53624 | CTLA4 | 1493 | 18637 | 1.1802 | 0.0000 | |
| GSE63941 | CTLA4 | 1493 | 234895_at | 0.1402 | 0.3863 | |
| GSE77861 | CTLA4 | 1493 | 234895_at | -0.0391 | 0.8074 | |
| GSE97050 | CTLA4 | 1493 | A_33_P3396139 | 1.0993 | 0.1499 | |
| SRP064894 | CTLA4 | 1493 | RNAseq | 1.1382 | 0.0000 | |
| SRP133303 | CTLA4 | 1493 | RNAseq | 1.0674 | 0.0019 | |
| SRP159526 | CTLA4 | 1493 | RNAseq | 0.8015 | 0.3674 | |
| SRP193095 | CTLA4 | 1493 | RNAseq | 1.0665 | 0.0006 | |
| SRP219564 | CTLA4 | 1493 | RNAseq | 1.5218 | 0.0272 | |
| TCGA | CTLA4 | 1493 | RNAseq | 1.3481 | 0.0000 |
Upregulated datasets: 6; Downregulated datasets: 0.
Survival by CTLA4 expression:
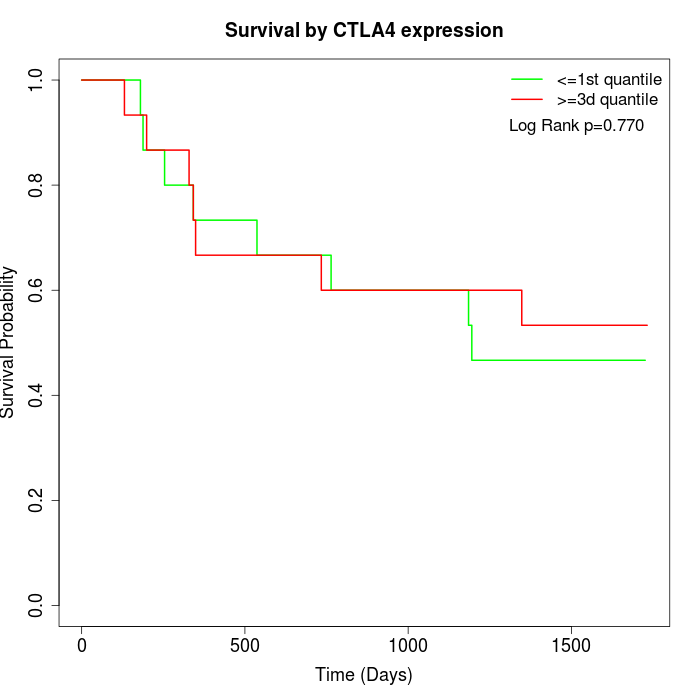 | 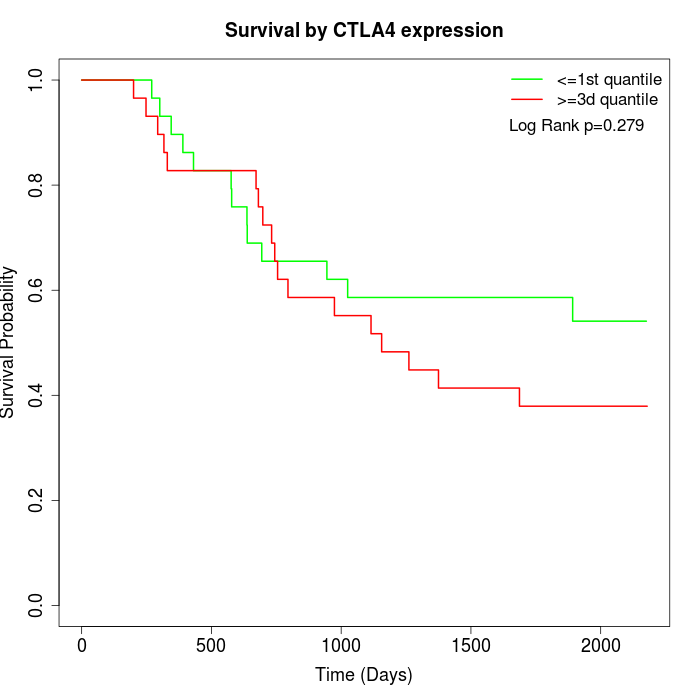 |  |
| GSE53622 | GSE53624 | TCGA |
Note: Click image to view full size file.
Copy number change of CTLA4:
| Dataset | Gene | EntrezID | Gain | Loss | Normal | Detail |
|---|---|---|---|---|---|---|
| GSE15526 | CTLA4 | 1493 | 6 | 4 | 20 | |
| GSE20123 | CTLA4 | 1493 | 6 | 4 | 20 | |
| GSE43470 | CTLA4 | 1493 | 1 | 4 | 38 | |
| GSE46452 | CTLA4 | 1493 | 1 | 4 | 54 | |
| GSE47630 | CTLA4 | 1493 | 4 | 5 | 31 | |
| GSE54993 | CTLA4 | 1493 | 0 | 3 | 67 | |
| GSE54994 | CTLA4 | 1493 | 10 | 8 | 35 | |
| GSE60625 | CTLA4 | 1493 | 0 | 3 | 8 | |
| GSE74703 | CTLA4 | 1493 | 1 | 3 | 32 | |
| GSE74704 | CTLA4 | 1493 | 3 | 2 | 15 | |
| TCGA | CTLA4 | 1493 | 20 | 13 | 63 |
Total number of gains: 52; Total number of losses: 53; Total Number of normals: 383.
Somatic mutations of CTLA4:
Generating mutation plots.
Highly correlated genes for CTLA4:
Showing top 20/698 corelated genes with mean PCC>0.5.
| Gene1 | Gene2 | Mean PCC | Num. Datasets | Num. PCC<0 | Num. PCC>0.5 |
|---|---|---|---|---|---|
| CTLA4 | CGA | 0.709409 | 5 | 0 | 5 |
| CTLA4 | AKNA | 0.709406 | 3 | 0 | 3 |
| CTLA4 | PRORY | 0.708879 | 3 | 0 | 3 |
| CTLA4 | ARVCF | 0.693371 | 3 | 0 | 3 |
| CTLA4 | WRNIP1 | 0.683854 | 6 | 0 | 6 |
| CTLA4 | NEUROD2 | 0.683275 | 4 | 0 | 4 |
| CTLA4 | FOXP3 | 0.681588 | 5 | 0 | 5 |
| CTLA4 | OR10H3 | 0.675518 | 5 | 0 | 5 |
| CTLA4 | KIF17 | 0.670938 | 3 | 0 | 3 |
| CTLA4 | NKG7 | 0.669631 | 5 | 0 | 4 |
| CTLA4 | KHDRBS2 | 0.664905 | 5 | 0 | 4 |
| CTLA4 | SSTR3 | 0.664715 | 5 | 0 | 5 |
| CTLA4 | SLAMF8 | 0.66392 | 7 | 0 | 6 |
| CTLA4 | MAPK11 | 0.662178 | 4 | 0 | 3 |
| CTLA4 | TRAT1 | 0.662021 | 4 | 0 | 3 |
| CTLA4 | TBX4 | 0.659946 | 4 | 0 | 3 |
| CTLA4 | SCN10A | 0.659006 | 5 | 0 | 4 |
| CTLA4 | HIVEP3 | 0.658803 | 4 | 0 | 4 |
| CTLA4 | CXCR5 | 0.657262 | 4 | 0 | 4 |
| CTLA4 | C8A | 0.656116 | 4 | 0 | 4 |
For details and further investigation, click here