| Full name: dipeptidase 1 | Alias Symbol: | ||
| Type: protein-coding gene | Cytoband: 16q24.3 | ||
| Entrez ID: 1800 | HGNC ID: HGNC:3002 | Ensembl Gene: ENSG00000015413 | OMIM ID: 179780 |
| Related drugs: CILASTATIN, CILASTATIN SODIUM, DEXAMETHASONE... [more] | |||
Expression of DPEP1:
| Dataset | Gene | EntrezID | Probe | Log2FC | Adj.pValue | Expression |
|---|---|---|---|---|---|---|
| GSE17351 | DPEP1 | 1800 | 205983_at | -0.1672 | 0.6462 | |
| GSE20347 | DPEP1 | 1800 | 205983_at | -0.1363 | 0.2046 | |
| GSE23400 | DPEP1 | 1800 | 205983_at | -0.3872 | 0.0000 | |
| GSE26886 | DPEP1 | 1800 | 205983_at | -0.0473 | 0.7327 | |
| GSE29001 | DPEP1 | 1800 | 205983_at | -0.2603 | 0.0921 | |
| GSE38129 | DPEP1 | 1800 | 205983_at | -0.1517 | 0.0467 | |
| GSE45670 | DPEP1 | 1800 | 205983_at | -0.1475 | 0.1029 | |
| GSE53622 | DPEP1 | 1800 | 15497 | 0.5288 | 0.0005 | |
| GSE53624 | DPEP1 | 1800 | 15497 | 0.6281 | 0.0000 | |
| GSE63941 | DPEP1 | 1800 | 205983_at | 0.1698 | 0.2818 | |
| GSE77861 | DPEP1 | 1800 | 205983_at | -0.0568 | 0.6657 | |
| GSE97050 | DPEP1 | 1800 | A_23_P152262 | 0.3014 | 0.2586 | |
| SRP219564 | DPEP1 | 1800 | RNAseq | 0.9836 | 0.1313 | |
| TCGA | DPEP1 | 1800 | RNAseq | -0.9275 | 0.1506 |
Upregulated datasets: 0; Downregulated datasets: 0.
Survival by DPEP1 expression:
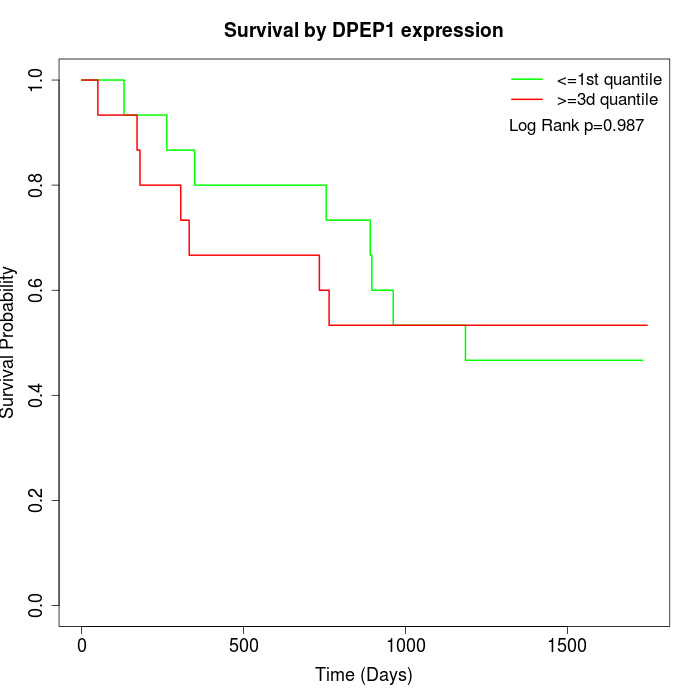 | 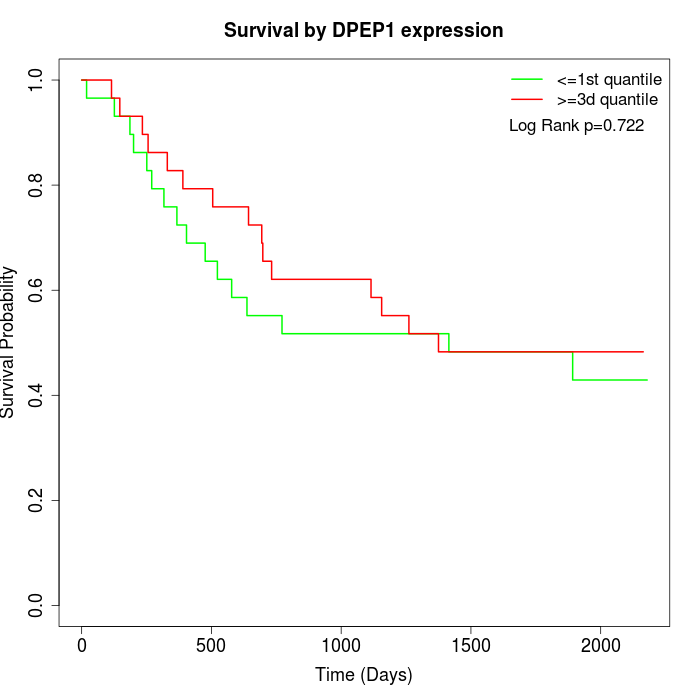 | 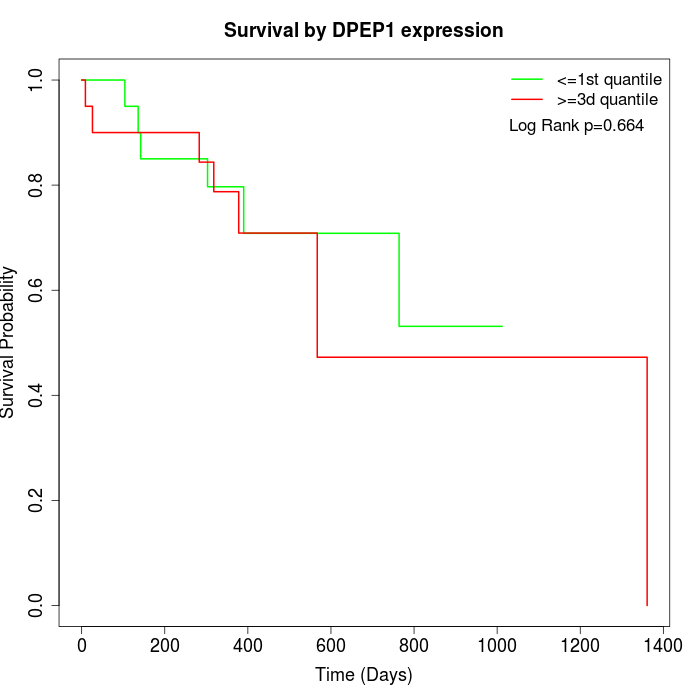 |
| GSE53622 | GSE53624 | TCGA |
Note: Click image to view full size file.
Copy number change of DPEP1:
| Dataset | Gene | EntrezID | Gain | Loss | Normal | Detail |
|---|---|---|---|---|---|---|
| GSE15526 | DPEP1 | 1800 | 4 | 3 | 23 | |
| GSE20123 | DPEP1 | 1800 | 4 | 3 | 23 | |
| GSE43470 | DPEP1 | 1800 | 1 | 13 | 29 | |
| GSE46452 | DPEP1 | 1800 | 38 | 1 | 20 | |
| GSE47630 | DPEP1 | 1800 | 11 | 9 | 20 | |
| GSE54993 | DPEP1 | 1800 | 3 | 4 | 63 | |
| GSE54994 | DPEP1 | 1800 | 9 | 11 | 33 | |
| GSE60625 | DPEP1 | 1800 | 4 | 0 | 7 | |
| GSE74703 | DPEP1 | 1800 | 1 | 9 | 26 | |
| GSE74704 | DPEP1 | 1800 | 3 | 1 | 16 | |
| TCGA | DPEP1 | 1800 | 26 | 15 | 55 |
Total number of gains: 104; Total number of losses: 69; Total Number of normals: 315.
Somatic mutations of DPEP1:
Generating mutation plots.
Highly correlated genes for DPEP1:
Showing top 20/927 corelated genes with mean PCC>0.5.
| Gene1 | Gene2 | Mean PCC | Num. Datasets | Num. PCC<0 | Num. PCC>0.5 |
|---|---|---|---|---|---|
| DPEP1 | TTLL9 | 0.72532 | 3 | 0 | 3 |
| DPEP1 | GAL3ST2 | 0.722407 | 3 | 0 | 3 |
| DPEP1 | OR1G1 | 0.722044 | 3 | 0 | 3 |
| DPEP1 | ABCC6 | 0.716826 | 4 | 0 | 4 |
| DPEP1 | CLCNKB | 0.706126 | 4 | 0 | 4 |
| DPEP1 | GNRH2 | 0.702842 | 5 | 0 | 5 |
| DPEP1 | DLK1 | 0.70097 | 3 | 0 | 3 |
| DPEP1 | EBF4 | 0.699839 | 3 | 0 | 3 |
| DPEP1 | IL17A | 0.696196 | 5 | 0 | 5 |
| DPEP1 | PRSS50 | 0.690713 | 3 | 0 | 3 |
| DPEP1 | THEG | 0.690654 | 7 | 0 | 6 |
| DPEP1 | GIPR | 0.683863 | 5 | 0 | 5 |
| DPEP1 | NR1H4 | 0.682861 | 4 | 0 | 4 |
| DPEP1 | TCP10L | 0.680703 | 5 | 0 | 5 |
| DPEP1 | NR0B2 | 0.675795 | 4 | 0 | 4 |
| DPEP1 | PDYN | 0.673182 | 5 | 0 | 5 |
| DPEP1 | CYP2D6 | 0.672735 | 7 | 0 | 6 |
| DPEP1 | EPB42 | 0.672714 | 8 | 0 | 8 |
| DPEP1 | CIB3 | 0.67258 | 4 | 0 | 4 |
| DPEP1 | IL9R | 0.670871 | 7 | 0 | 6 |
For details and further investigation, click here