| Full name: serine protease 50 | Alias Symbol: TSP50|CT20 | ||
| Type: protein-coding gene | Cytoband: 3p21.31 | ||
| Entrez ID: 29122 | HGNC ID: HGNC:17910 | Ensembl Gene: ENSG00000283706 | OMIM ID: 607950 |
Expression of PRSS50:
| Dataset | Gene | EntrezID | Probe | Log2FC | Adj.pValue | Expression |
|---|---|---|---|---|---|---|
| GSE17351 | PRSS50 | 29122 | 220126_at | 0.1407 | 0.7026 | |
| GSE20347 | PRSS50 | 29122 | 220126_at | -0.1292 | 0.0847 | |
| GSE23400 | PRSS50 | 29122 | 220126_at | -0.1715 | 0.0000 | |
| GSE26886 | PRSS50 | 29122 | 220126_at | 0.5751 | 0.0003 | |
| GSE29001 | PRSS50 | 29122 | 220126_at | -0.1221 | 0.3198 | |
| GSE38129 | PRSS50 | 29122 | 220126_at | -0.1497 | 0.0365 | |
| GSE45670 | PRSS50 | 29122 | 220126_at | 0.0505 | 0.6954 | |
| GSE53622 | PRSS50 | 29122 | 138573 | 0.3154 | 0.0031 | |
| GSE53624 | PRSS50 | 29122 | 138573 | 0.7209 | 0.0000 | |
| GSE63941 | PRSS50 | 29122 | 220126_at | -0.0895 | 0.5770 | |
| GSE77861 | PRSS50 | 29122 | 220126_at | -0.1677 | 0.0777 | |
| TCGA | PRSS50 | 29122 | RNAseq | 1.0346 | 0.2730 |
Upregulated datasets: 0; Downregulated datasets: 0.
Survival by PRSS50 expression:
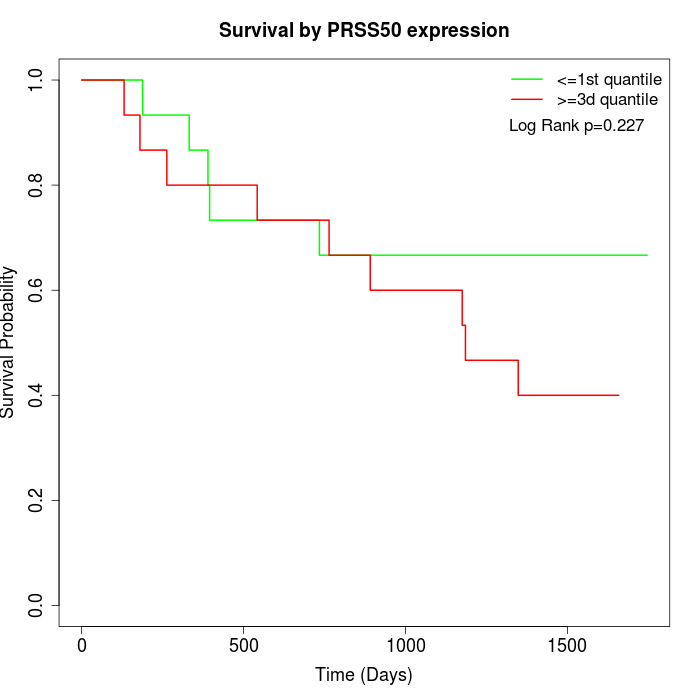 | 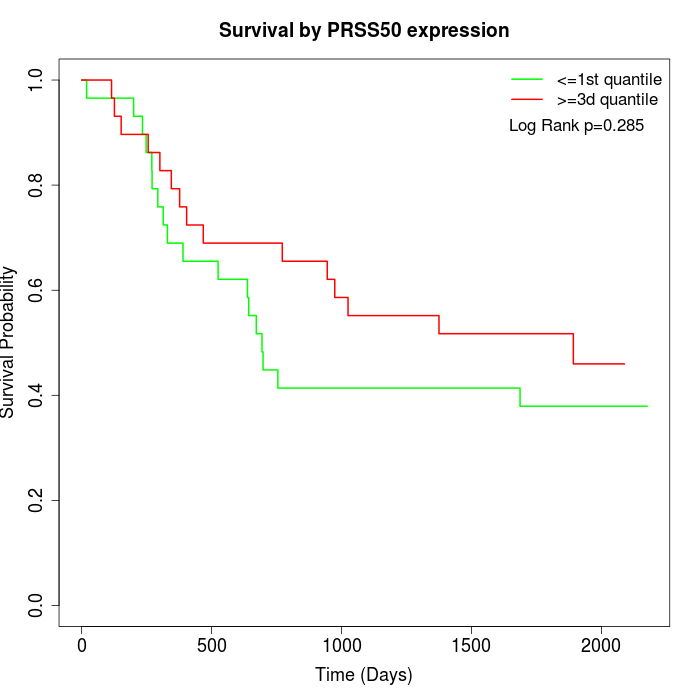 | 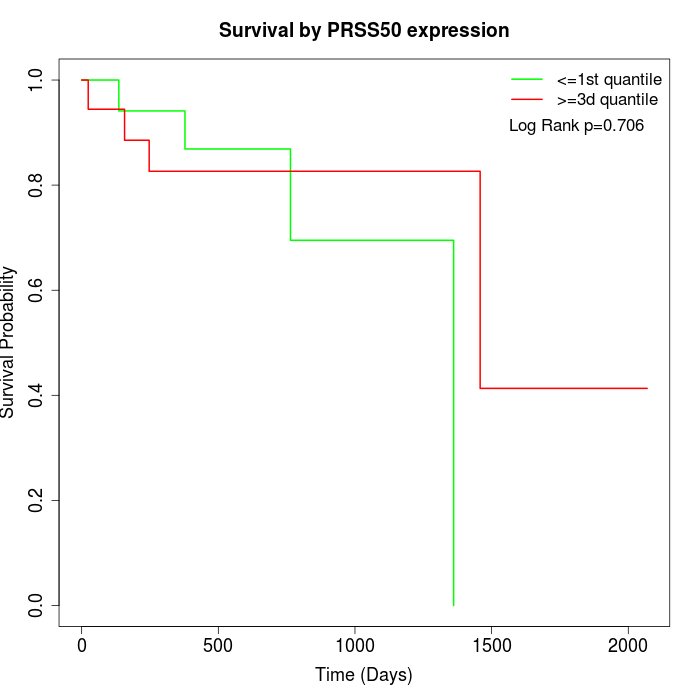 |
| GSE53622 | GSE53624 | TCGA |
Note: Click image to view full size file.
Copy number change of PRSS50:
| Dataset | Gene | EntrezID | Gain | Loss | Normal | Detail |
|---|---|---|---|---|---|---|
| GSE15526 | PRSS50 | 29122 | 0 | 18 | 12 | |
| GSE20123 | PRSS50 | 29122 | 0 | 19 | 11 | |
| GSE43470 | PRSS50 | 29122 | 0 | 19 | 24 | |
| GSE46452 | PRSS50 | 29122 | 2 | 17 | 40 | |
| GSE47630 | PRSS50 | 29122 | 2 | 23 | 15 | |
| GSE54993 | PRSS50 | 29122 | 7 | 2 | 61 | |
| GSE54994 | PRSS50 | 29122 | 0 | 36 | 17 | |
| GSE60625 | PRSS50 | 29122 | 5 | 0 | 6 | |
| GSE74703 | PRSS50 | 29122 | 0 | 15 | 21 | |
| GSE74704 | PRSS50 | 29122 | 0 | 12 | 8 | |
| TCGA | PRSS50 | 29122 | 1 | 75 | 20 |
Total number of gains: 17; Total number of losses: 236; Total Number of normals: 235.
Somatic mutations of PRSS50:
Generating mutation plots.
Highly correlated genes for PRSS50:
Showing top 20/506 corelated genes with mean PCC>0.5.
| Gene1 | Gene2 | Mean PCC | Num. Datasets | Num. PCC<0 | Num. PCC>0.5 |
|---|---|---|---|---|---|
| PRSS50 | KLK14 | 0.712431 | 3 | 0 | 3 |
| PRSS50 | THRB | 0.711218 | 3 | 0 | 3 |
| PRSS50 | CCIN | 0.710818 | 4 | 0 | 4 |
| PRSS50 | IL25 | 0.707579 | 3 | 0 | 3 |
| PRSS50 | TAS2R3 | 0.7052 | 3 | 0 | 3 |
| PRSS50 | SYNGAP1 | 0.703704 | 3 | 0 | 3 |
| PRSS50 | CITED1 | 0.695686 | 4 | 0 | 4 |
| PRSS50 | KIR3DL3 | 0.693082 | 3 | 0 | 3 |
| PRSS50 | CHAT | 0.69254 | 3 | 0 | 3 |
| PRSS50 | GDF5 | 0.690781 | 3 | 0 | 3 |
| PRSS50 | DPEP1 | 0.690713 | 3 | 0 | 3 |
| PRSS50 | GALNTL5 | 0.687822 | 3 | 0 | 3 |
| PRSS50 | PIK3R5 | 0.687296 | 3 | 0 | 3 |
| PRSS50 | EDN2 | 0.68281 | 3 | 0 | 3 |
| PRSS50 | JAK3 | 0.679779 | 3 | 0 | 3 |
| PRSS50 | CPAMD8 | 0.679008 | 3 | 0 | 3 |
| PRSS50 | HCN4 | 0.677691 | 3 | 0 | 3 |
| PRSS50 | CHRNB3 | 0.672178 | 3 | 0 | 3 |
| PRSS50 | SLC39A3 | 0.668292 | 3 | 0 | 3 |
| PRSS50 | BFSP2 | 0.666469 | 3 | 0 | 3 |
For details and further investigation, click here