| Full name: endothelin converting enzyme 1 | Alias Symbol: | ||
| Type: protein-coding gene | Cytoband: 1p36.12 | ||
| Entrez ID: 1889 | HGNC ID: HGNC:3146 | Ensembl Gene: ENSG00000117298 | OMIM ID: 600423 |
| Related drugs: ARDENERMIN, CHEMBL571153, DAGLUTRIL, INDOLE-3-BUTYRIC ACID... [more] | |||
Screen Evidence:
| |||
Expression of ECE1:
| Dataset | Gene | EntrezID | Probe | Log2FC | Adj.pValue | Expression |
|---|---|---|---|---|---|---|
| GSE17351 | ECE1 | 1889 | 201749_at | 0.9075 | 0.0416 | |
| GSE20347 | ECE1 | 1889 | 201749_at | 0.7891 | 0.0000 | |
| GSE23400 | ECE1 | 1889 | 201749_at | 0.4012 | 0.0000 | |
| GSE26886 | ECE1 | 1889 | 201749_at | 1.2575 | 0.0000 | |
| GSE29001 | ECE1 | 1889 | 201749_at | 0.5066 | 0.0195 | |
| GSE38129 | ECE1 | 1889 | 201749_at | 0.5963 | 0.0021 | |
| GSE45670 | ECE1 | 1889 | 201749_at | 0.3178 | 0.0416 | |
| GSE53622 | ECE1 | 1889 | 161921 | 0.8522 | 0.0000 | |
| GSE53624 | ECE1 | 1889 | 161921 | 0.9482 | 0.0000 | |
| GSE63941 | ECE1 | 1889 | 201749_at | -0.9322 | 0.0140 | |
| GSE77861 | ECE1 | 1889 | 201749_at | 0.5655 | 0.0331 | |
| GSE97050 | ECE1 | 1889 | A_24_P154080 | 1.0299 | 0.0872 | |
| SRP007169 | ECE1 | 1889 | RNAseq | 2.3673 | 0.0000 | |
| SRP008496 | ECE1 | 1889 | RNAseq | 2.3407 | 0.0000 | |
| SRP064894 | ECE1 | 1889 | RNAseq | 1.2277 | 0.0000 | |
| SRP133303 | ECE1 | 1889 | RNAseq | 0.7757 | 0.0015 | |
| SRP159526 | ECE1 | 1889 | RNAseq | 1.5587 | 0.0000 | |
| SRP193095 | ECE1 | 1889 | RNAseq | 1.6337 | 0.0000 | |
| SRP219564 | ECE1 | 1889 | RNAseq | 0.6851 | 0.1715 | |
| TCGA | ECE1 | 1889 | RNAseq | 0.0854 | 0.1572 |
Upregulated datasets: 6; Downregulated datasets: 0.
Survival by ECE1 expression:
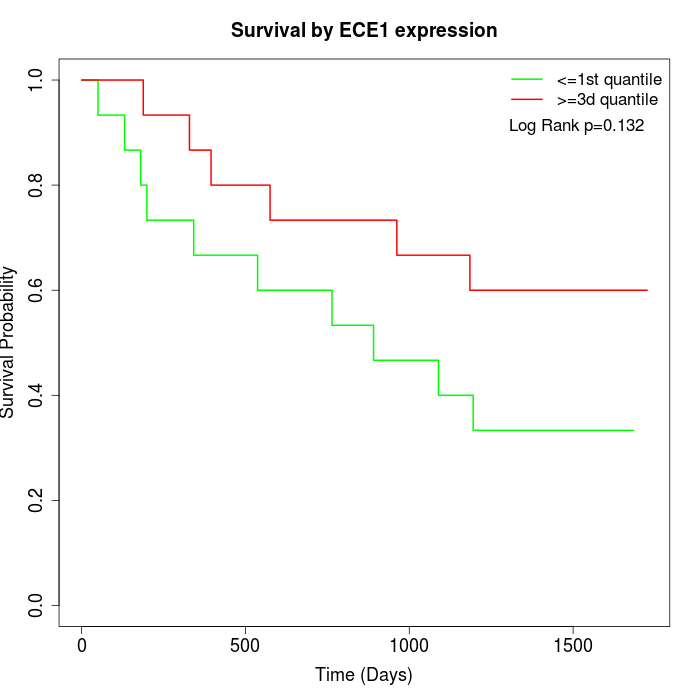 | 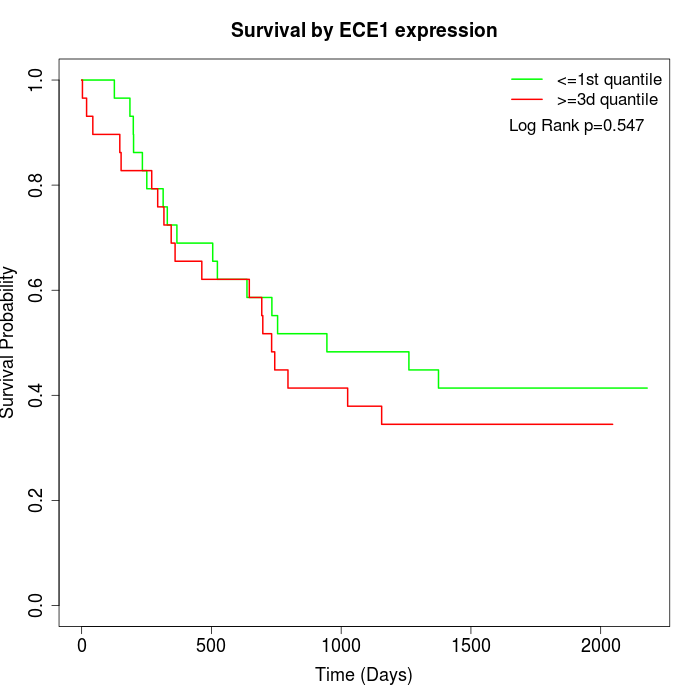 | 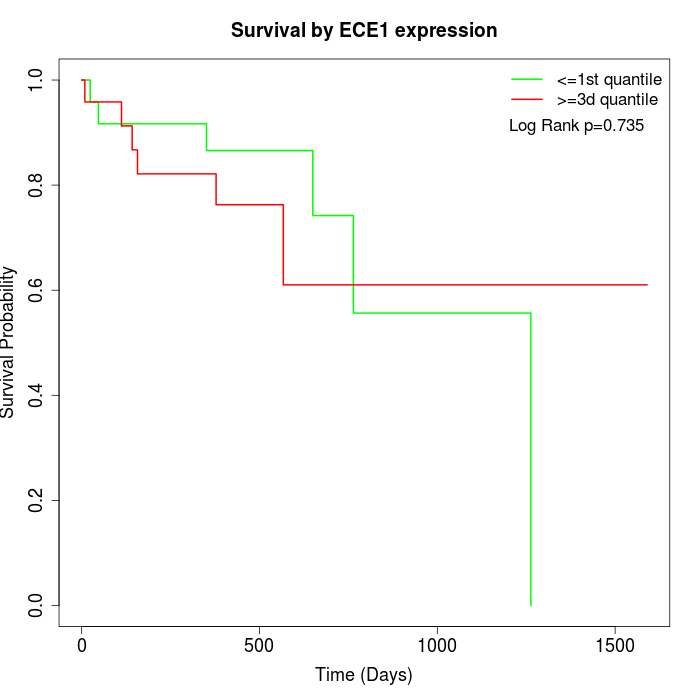 |
| GSE53622 | GSE53624 | TCGA |
Note: Click image to view full size file.
Copy number change of ECE1:
| Dataset | Gene | EntrezID | Gain | Loss | Normal | Detail |
|---|---|---|---|---|---|---|
| GSE15526 | ECE1 | 1889 | 0 | 5 | 25 | |
| GSE20123 | ECE1 | 1889 | 0 | 4 | 26 | |
| GSE43470 | ECE1 | 1889 | 2 | 6 | 35 | |
| GSE46452 | ECE1 | 1889 | 5 | 1 | 53 | |
| GSE47630 | ECE1 | 1889 | 8 | 3 | 29 | |
| GSE54993 | ECE1 | 1889 | 3 | 1 | 66 | |
| GSE54994 | ECE1 | 1889 | 11 | 4 | 38 | |
| GSE60625 | ECE1 | 1889 | 0 | 0 | 11 | |
| GSE74703 | ECE1 | 1889 | 1 | 4 | 31 | |
| GSE74704 | ECE1 | 1889 | 0 | 0 | 20 | |
| TCGA | ECE1 | 1889 | 9 | 23 | 64 |
Total number of gains: 39; Total number of losses: 51; Total Number of normals: 398.
Somatic mutations of ECE1:
Generating mutation plots.
Highly correlated genes for ECE1:
Showing top 20/1478 corelated genes with mean PCC>0.5.
| Gene1 | Gene2 | Mean PCC | Num. Datasets | Num. PCC<0 | Num. PCC>0.5 |
|---|---|---|---|---|---|
| ECE1 | PYCR2 | 0.809583 | 3 | 0 | 3 |
| ECE1 | FADS1 | 0.760715 | 3 | 0 | 3 |
| ECE1 | SLC39A3 | 0.75231 | 4 | 0 | 4 |
| ECE1 | TMEM184B | 0.730403 | 11 | 0 | 10 |
| ECE1 | PDIA5 | 0.729638 | 3 | 0 | 3 |
| ECE1 | SNAP47 | 0.720004 | 3 | 0 | 3 |
| ECE1 | CD276 | 0.717685 | 5 | 0 | 5 |
| ECE1 | COMMD7 | 0.71317 | 4 | 0 | 3 |
| ECE1 | RAB34 | 0.712916 | 3 | 0 | 3 |
| ECE1 | INTS10 | 0.712112 | 3 | 0 | 3 |
| ECE1 | MAN1A1 | 0.710951 | 5 | 0 | 4 |
| ECE1 | HEY1 | 0.708749 | 11 | 0 | 11 |
| ECE1 | PLXNA1 | 0.70631 | 11 | 0 | 10 |
| ECE1 | RNF4 | 0.705865 | 3 | 0 | 3 |
| ECE1 | LRRC8C | 0.705485 | 3 | 0 | 3 |
| ECE1 | NAA38 | 0.704856 | 4 | 0 | 3 |
| ECE1 | DGKQ | 0.704233 | 3 | 0 | 3 |
| ECE1 | HMCN1 | 0.703063 | 4 | 0 | 4 |
| ECE1 | CLPTM1L | 0.702239 | 7 | 0 | 7 |
| ECE1 | SLC41A1 | 0.700297 | 7 | 0 | 7 |
For details and further investigation, click here