| Full name: EPS8 like 1 | Alias Symbol: FLJ20258|DRC3|MGC23164|MGC4642 | ||
| Type: protein-coding gene | Cytoband: 19q13.42 | ||
| Entrez ID: 54869 | HGNC ID: HGNC:21295 | Ensembl Gene: ENSG00000131037 | OMIM ID: 614987 |
Expression of EPS8L1:
| Dataset | Gene | EntrezID | Probe | Log2FC | Adj.pValue | Expression |
|---|---|---|---|---|---|---|
| GSE17351 | EPS8L1 | 54869 | 91826_at | -2.0100 | 0.1467 | |
| GSE20347 | EPS8L1 | 54869 | 91826_at | -2.8230 | 0.0000 | |
| GSE23400 | EPS8L1 | 54869 | 91826_at | -2.2989 | 0.0000 | |
| GSE26886 | EPS8L1 | 54869 | 91826_at | -3.9014 | 0.0000 | |
| GSE29001 | EPS8L1 | 54869 | 91826_at | -2.7561 | 0.0002 | |
| GSE38129 | EPS8L1 | 54869 | 91826_at | -2.2470 | 0.0000 | |
| GSE45670 | EPS8L1 | 54869 | 91826_at | -1.2213 | 0.0126 | |
| GSE53622 | EPS8L1 | 54869 | 64134 | -2.8629 | 0.0000 | |
| GSE53624 | EPS8L1 | 54869 | 64134 | -3.2992 | 0.0000 | |
| GSE63941 | EPS8L1 | 54869 | 91826_at | 1.2851 | 0.0150 | |
| GSE77861 | EPS8L1 | 54869 | 91826_at | -2.2755 | 0.0010 | |
| GSE97050 | EPS8L1 | 54869 | A_33_P3220698 | -1.0540 | 0.2151 | |
| SRP007169 | EPS8L1 | 54869 | RNAseq | -5.1052 | 0.0000 | |
| SRP008496 | EPS8L1 | 54869 | RNAseq | -5.0595 | 0.0000 | |
| SRP064894 | EPS8L1 | 54869 | RNAseq | -3.8016 | 0.0000 | |
| SRP133303 | EPS8L1 | 54869 | RNAseq | -3.1947 | 0.0000 | |
| SRP159526 | EPS8L1 | 54869 | RNAseq | -5.0652 | 0.0000 | |
| SRP193095 | EPS8L1 | 54869 | RNAseq | -3.3965 | 0.0000 | |
| SRP219564 | EPS8L1 | 54869 | RNAseq | -3.6481 | 0.0004 | |
| TCGA | EPS8L1 | 54869 | RNAseq | -0.2818 | 0.2050 |
Upregulated datasets: 1; Downregulated datasets: 16.
Survival by EPS8L1 expression:
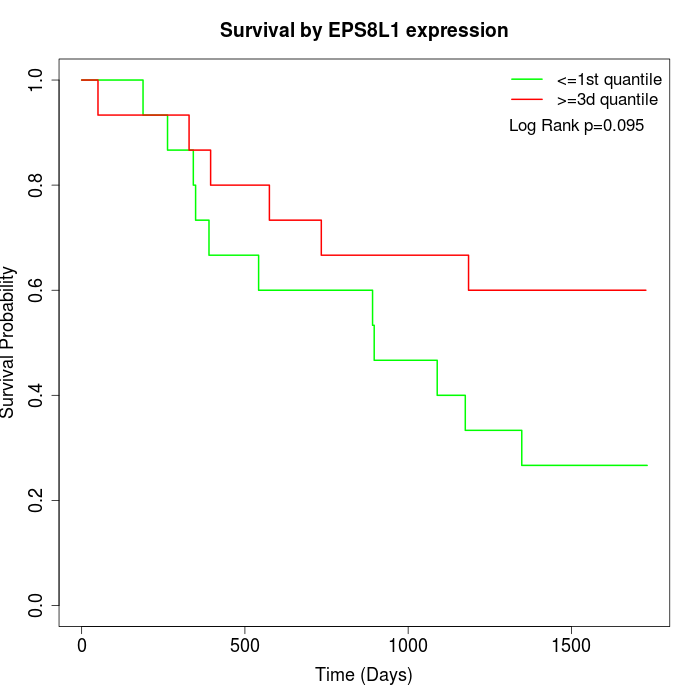 | 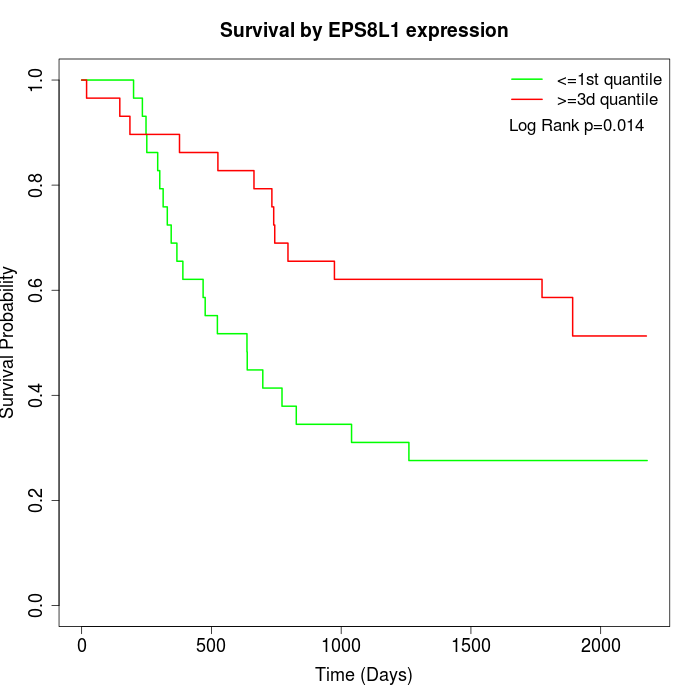 | 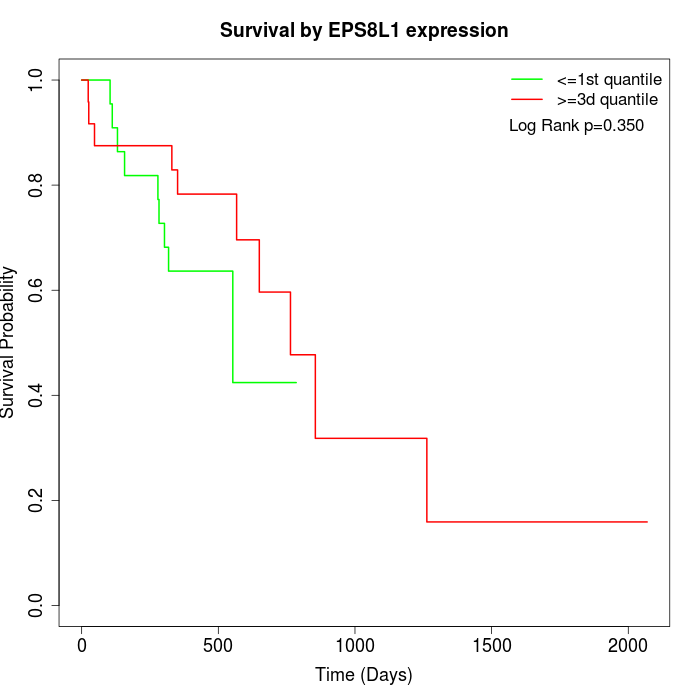 |
| GSE53622 | GSE53624 | TCGA |
Note: Click image to view full size file.
Copy number change of EPS8L1:
| Dataset | Gene | EntrezID | Gain | Loss | Normal | Detail |
|---|---|---|---|---|---|---|
| GSE15526 | EPS8L1 | 54869 | 3 | 4 | 23 | |
| GSE20123 | EPS8L1 | 54869 | 3 | 3 | 24 | |
| GSE43470 | EPS8L1 | 54869 | 3 | 11 | 29 | |
| GSE46452 | EPS8L1 | 54869 | 45 | 1 | 13 | |
| GSE47630 | EPS8L1 | 54869 | 8 | 6 | 26 | |
| GSE54993 | EPS8L1 | 54869 | 17 | 4 | 49 | |
| GSE54994 | EPS8L1 | 54869 | 4 | 13 | 36 | |
| GSE60625 | EPS8L1 | 54869 | 9 | 0 | 2 | |
| GSE74703 | EPS8L1 | 54869 | 3 | 7 | 26 | |
| GSE74704 | EPS8L1 | 54869 | 3 | 1 | 16 | |
| TCGA | EPS8L1 | 54869 | 19 | 14 | 63 |
Total number of gains: 117; Total number of losses: 64; Total Number of normals: 307.
Somatic mutations of EPS8L1:
Generating mutation plots.
Highly correlated genes for EPS8L1:
Showing top 20/1656 corelated genes with mean PCC>0.5.
| Gene1 | Gene2 | Mean PCC | Num. Datasets | Num. PCC<0 | Num. PCC>0.5 |
|---|---|---|---|---|---|
| EPS8L1 | KRT78 | 0.898034 | 8 | 0 | 8 |
| EPS8L1 | IL36A | 0.882852 | 11 | 0 | 11 |
| EPS8L1 | EPS8L2 | 0.882298 | 11 | 0 | 11 |
| EPS8L1 | NCCRP1 | 0.881424 | 4 | 0 | 4 |
| EPS8L1 | GDPD3 | 0.877962 | 13 | 0 | 13 |
| EPS8L1 | VSIG10L | 0.87711 | 7 | 0 | 7 |
| EPS8L1 | FLG | 0.875117 | 11 | 0 | 11 |
| EPS8L1 | RANBP9 | 0.87403 | 11 | 0 | 11 |
| EPS8L1 | SCNN1B | 0.872588 | 12 | 0 | 11 |
| EPS8L1 | CRCT1 | 0.872485 | 12 | 0 | 12 |
| EPS8L1 | UPK1A | 0.871895 | 11 | 0 | 11 |
| EPS8L1 | TTC9 | 0.870982 | 12 | 0 | 12 |
| EPS8L1 | FUT3 | 0.869861 | 13 | 0 | 13 |
| EPS8L1 | PADI1 | 0.867589 | 9 | 0 | 9 |
| EPS8L1 | EMP1 | 0.866778 | 11 | 0 | 11 |
| EPS8L1 | EVPL | 0.864453 | 13 | 0 | 13 |
| EPS8L1 | CLIC3 | 0.863267 | 11 | 0 | 10 |
| EPS8L1 | CYSRT1 | 0.861893 | 7 | 0 | 7 |
| EPS8L1 | ANXA9 | 0.859295 | 12 | 0 | 12 |
| EPS8L1 | FAM214A | 0.859082 | 6 | 0 | 6 |
For details and further investigation, click here