| Full name: flotillin 2 | Alias Symbol: ESA|ESA1|ECS-1|ECS1 | ||
| Type: protein-coding gene | Cytoband: 17q11.2 | ||
| Entrez ID: 2319 | HGNC ID: HGNC:3758 | Ensembl Gene: ENSG00000132589 | OMIM ID: 131560 |
Expression of FLOT2:
| Dataset | Gene | EntrezID | Probe | Log2FC | Adj.pValue | Expression |
|---|---|---|---|---|---|---|
| GSE17351 | FLOT2 | 2319 | 201350_at | 0.2305 | 0.5384 | |
| GSE20347 | FLOT2 | 2319 | 201350_at | 0.0544 | 0.7882 | |
| GSE23400 | FLOT2 | 2319 | 201350_at | 0.1292 | 0.0418 | |
| GSE26886 | FLOT2 | 2319 | 201350_at | -0.0796 | 0.7654 | |
| GSE29001 | FLOT2 | 2319 | 201350_at | 0.1835 | 0.5670 | |
| GSE38129 | FLOT2 | 2319 | 201350_at | 0.0316 | 0.8268 | |
| GSE45670 | FLOT2 | 2319 | 201350_at | 0.1241 | 0.5161 | |
| GSE53622 | FLOT2 | 2319 | 10315 | 0.0862 | 0.3046 | |
| GSE53624 | FLOT2 | 2319 | 10315 | 0.2628 | 0.0003 | |
| GSE63941 | FLOT2 | 2319 | 201350_at | 1.4083 | 0.0031 | |
| GSE77861 | FLOT2 | 2319 | 201350_at | 0.1832 | 0.6626 | |
| GSE97050 | FLOT2 | 2319 | A_23_P55319 | 0.1217 | 0.5809 | |
| SRP007169 | FLOT2 | 2319 | RNAseq | 0.6937 | 0.1612 | |
| SRP008496 | FLOT2 | 2319 | RNAseq | 0.8366 | 0.0122 | |
| SRP064894 | FLOT2 | 2319 | RNAseq | 0.6290 | 0.0046 | |
| SRP133303 | FLOT2 | 2319 | RNAseq | -0.0900 | 0.7155 | |
| SRP159526 | FLOT2 | 2319 | RNAseq | 0.1303 | 0.5609 | |
| SRP193095 | FLOT2 | 2319 | RNAseq | 0.2951 | 0.0172 | |
| SRP219564 | FLOT2 | 2319 | RNAseq | -0.1652 | 0.6409 | |
| TCGA | FLOT2 | 2319 | RNAseq | 0.1036 | 0.0351 |
Upregulated datasets: 1; Downregulated datasets: 0.
Survival by FLOT2 expression:
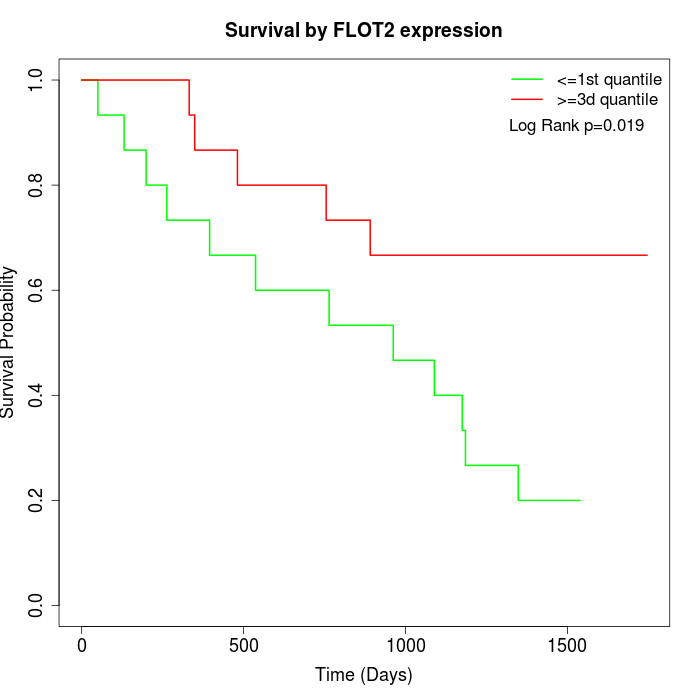 | 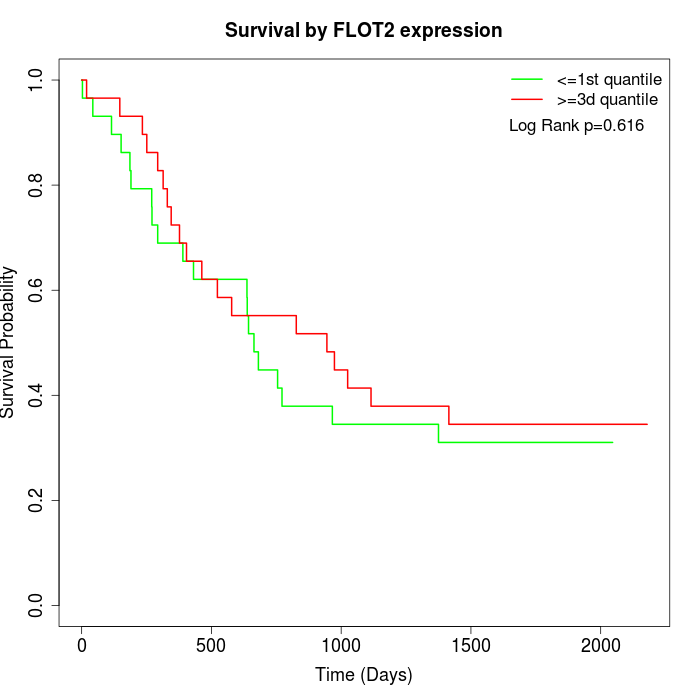 | 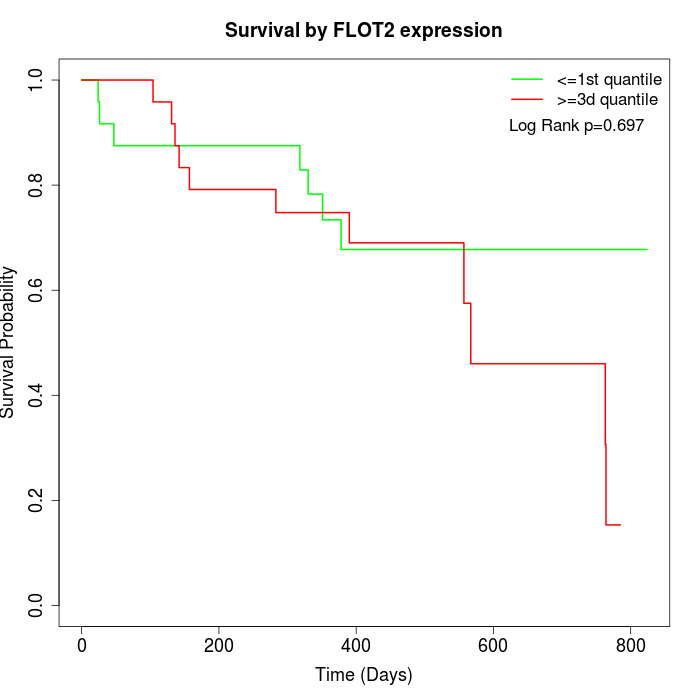 |
| GSE53622 | GSE53624 | TCGA |
Note: Click image to view full size file.
Copy number change of FLOT2:
| Dataset | Gene | EntrezID | Gain | Loss | Normal | Detail |
|---|---|---|---|---|---|---|
| GSE15526 | FLOT2 | 2319 | 10 | 1 | 19 | |
| GSE20123 | FLOT2 | 2319 | 10 | 1 | 19 | |
| GSE43470 | FLOT2 | 2319 | 0 | 1 | 42 | |
| GSE46452 | FLOT2 | 2319 | 33 | 1 | 25 | |
| GSE47630 | FLOT2 | 2319 | 7 | 1 | 32 | |
| GSE54993 | FLOT2 | 2319 | 2 | 3 | 65 | |
| GSE54994 | FLOT2 | 2319 | 7 | 6 | 40 | |
| GSE60625 | FLOT2 | 2319 | 4 | 0 | 7 | |
| GSE74703 | FLOT2 | 2319 | 0 | 1 | 35 | |
| GSE74704 | FLOT2 | 2319 | 7 | 1 | 12 | |
| TCGA | FLOT2 | 2319 | 21 | 10 | 65 |
Total number of gains: 101; Total number of losses: 26; Total Number of normals: 361.
Somatic mutations of FLOT2:
Generating mutation plots.
Highly correlated genes for FLOT2:
Showing top 20/254 corelated genes with mean PCC>0.5.
| Gene1 | Gene2 | Mean PCC | Num. Datasets | Num. PCC<0 | Num. PCC>0.5 |
|---|---|---|---|---|---|
| FLOT2 | ZNF747 | 0.811125 | 3 | 0 | 3 |
| FLOT2 | MAP3K13 | 0.772001 | 3 | 0 | 3 |
| FLOT2 | ZHX2 | 0.761398 | 3 | 0 | 3 |
| FLOT2 | OXA1L | 0.742834 | 3 | 0 | 3 |
| FLOT2 | CD22 | 0.741054 | 3 | 0 | 3 |
| FLOT2 | ARHGEF2 | 0.740175 | 3 | 0 | 3 |
| FLOT2 | FAM86C1 | 0.735915 | 3 | 0 | 3 |
| FLOT2 | RALGAPA2 | 0.73248 | 3 | 0 | 3 |
| FLOT2 | SLC27A3 | 0.720723 | 3 | 0 | 3 |
| FLOT2 | ASXL2 | 0.718291 | 3 | 0 | 3 |
| FLOT2 | FKBP4 | 0.711192 | 4 | 0 | 3 |
| FLOT2 | CXCL16 | 0.708725 | 4 | 0 | 3 |
| FLOT2 | TMEM170A | 0.70826 | 3 | 0 | 3 |
| FLOT2 | SPRYD4 | 0.706564 | 3 | 0 | 3 |
| FLOT2 | CTSH | 0.702053 | 3 | 0 | 3 |
| FLOT2 | CUTA | 0.70039 | 3 | 0 | 3 |
| FLOT2 | ARV1 | 0.698235 | 3 | 0 | 3 |
| FLOT2 | CMIP | 0.696515 | 3 | 0 | 3 |
| FLOT2 | CIC | 0.696186 | 3 | 0 | 3 |
| FLOT2 | TMPO | 0.693248 | 3 | 0 | 3 |
For details and further investigation, click here