| Full name: FRAT regulator of WNT signaling pathway 1 | Alias Symbol: | ||
| Type: protein-coding gene | Cytoband: 10q24.1 | ||
| Entrez ID: 10023 | HGNC ID: HGNC:3944 | Ensembl Gene: ENSG00000165879 | OMIM ID: 602503 |
FRAT1 involved pathways:
| KEGG pathway | Description | View |
|---|---|---|
| hsa04310 | Wnt signaling pathway |
Expression of FRAT1:
| Dataset | Gene | EntrezID | Probe | Log2FC | Adj.pValue | Expression |
|---|---|---|---|---|---|---|
| GSE17351 | FRAT1 | 10023 | 219889_at | 0.0171 | 0.9895 | |
| GSE20347 | FRAT1 | 10023 | 219889_at | -0.2978 | 0.0196 | |
| GSE23400 | FRAT1 | 10023 | 219889_at | -0.2545 | 0.0000 | |
| GSE26886 | FRAT1 | 10023 | 219889_at | -0.0295 | 0.9352 | |
| GSE29001 | FRAT1 | 10023 | 219889_at | -0.1797 | 0.4079 | |
| GSE38129 | FRAT1 | 10023 | 219889_at | -0.3346 | 0.0009 | |
| GSE45670 | FRAT1 | 10023 | 219889_at | -0.1852 | 0.3836 | |
| GSE53622 | FRAT1 | 10023 | 42269 | -0.8289 | 0.0000 | |
| GSE53624 | FRAT1 | 10023 | 42269 | -0.3093 | 0.0208 | |
| GSE63941 | FRAT1 | 10023 | 219889_at | 0.0677 | 0.9213 | |
| GSE77861 | FRAT1 | 10023 | 219889_at | -0.1664 | 0.2622 | |
| GSE97050 | FRAT1 | 10023 | A_33_P3367899 | -0.2144 | 0.3453 | |
| SRP064894 | FRAT1 | 10023 | RNAseq | -0.0432 | 0.8951 | |
| SRP133303 | FRAT1 | 10023 | RNAseq | -0.3534 | 0.1000 | |
| SRP159526 | FRAT1 | 10023 | RNAseq | -0.0184 | 0.9714 | |
| SRP193095 | FRAT1 | 10023 | RNAseq | -0.4976 | 0.0488 | |
| SRP219564 | FRAT1 | 10023 | RNAseq | 0.6532 | 0.1097 | |
| TCGA | FRAT1 | 10023 | RNAseq | -0.3149 | 0.0039 |
Upregulated datasets: 0; Downregulated datasets: 0.
Survival by FRAT1 expression:
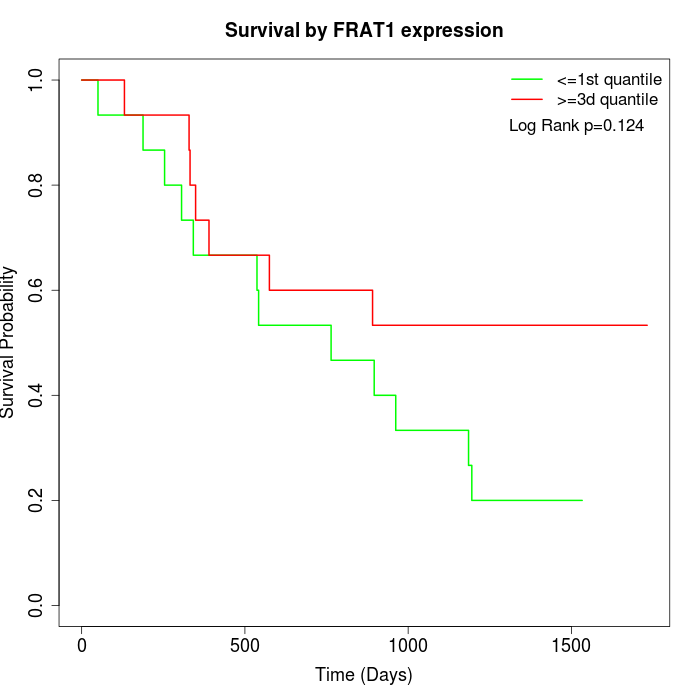 | 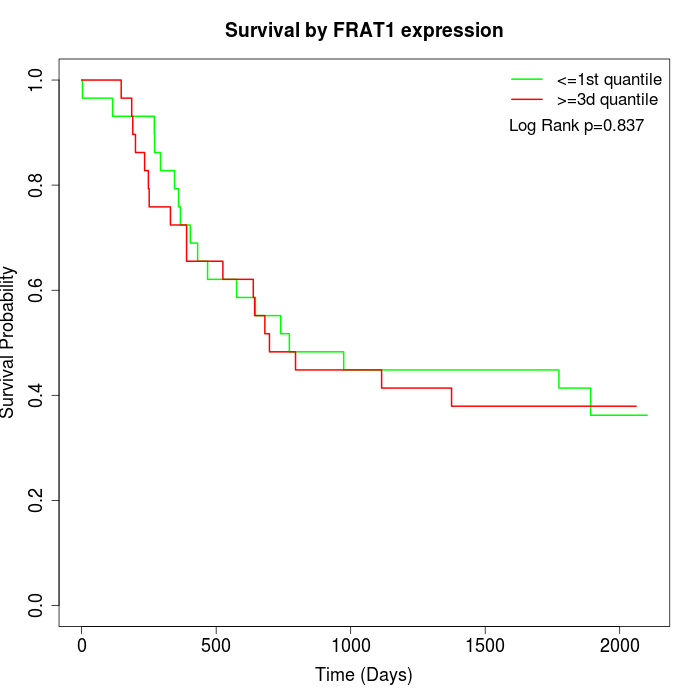 | 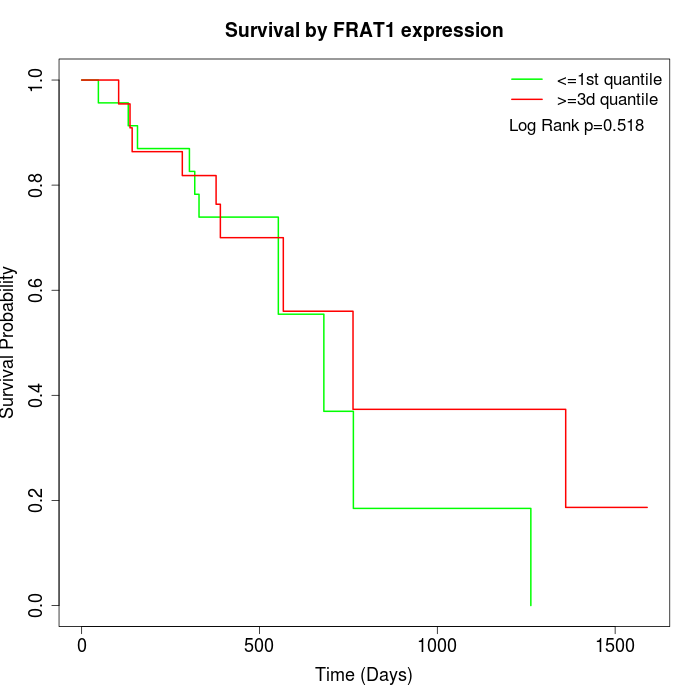 |
| GSE53622 | GSE53624 | TCGA |
Note: Click image to view full size file.
Copy number change of FRAT1:
| Dataset | Gene | EntrezID | Gain | Loss | Normal | Detail |
|---|---|---|---|---|---|---|
| GSE15526 | FRAT1 | 10023 | 0 | 8 | 22 | |
| GSE20123 | FRAT1 | 10023 | 0 | 7 | 23 | |
| GSE43470 | FRAT1 | 10023 | 0 | 7 | 36 | |
| GSE46452 | FRAT1 | 10023 | 0 | 11 | 48 | |
| GSE47630 | FRAT1 | 10023 | 2 | 14 | 24 | |
| GSE54993 | FRAT1 | 10023 | 8 | 0 | 62 | |
| GSE54994 | FRAT1 | 10023 | 2 | 10 | 41 | |
| GSE60625 | FRAT1 | 10023 | 0 | 0 | 11 | |
| GSE74703 | FRAT1 | 10023 | 0 | 5 | 31 | |
| GSE74704 | FRAT1 | 10023 | 0 | 4 | 16 | |
| TCGA | FRAT1 | 10023 | 5 | 28 | 63 |
Total number of gains: 17; Total number of losses: 94; Total Number of normals: 377.
Somatic mutations of FRAT1:
Generating mutation plots.
Highly correlated genes for FRAT1:
Showing top 20/557 corelated genes with mean PCC>0.5.
| Gene1 | Gene2 | Mean PCC | Num. Datasets | Num. PCC<0 | Num. PCC>0.5 |
|---|---|---|---|---|---|
| FRAT1 | CNOT10 | 0.759481 | 3 | 0 | 3 |
| FRAT1 | TMEM50A | 0.735897 | 3 | 0 | 3 |
| FRAT1 | GIMAP5 | 0.733969 | 3 | 0 | 3 |
| FRAT1 | SREBF2 | 0.732606 | 3 | 0 | 3 |
| FRAT1 | ING3 | 0.729294 | 3 | 0 | 3 |
| FRAT1 | MTFMT | 0.723864 | 3 | 0 | 3 |
| FRAT1 | JMY | 0.721764 | 3 | 0 | 3 |
| FRAT1 | ABHD16A | 0.710327 | 3 | 0 | 3 |
| FRAT1 | SIDT2 | 0.707244 | 3 | 0 | 3 |
| FRAT1 | OS9 | 0.698156 | 4 | 0 | 3 |
| FRAT1 | PCTP | 0.697833 | 4 | 0 | 4 |
| FRAT1 | LRRC41 | 0.696637 | 3 | 0 | 3 |
| FRAT1 | ZNF555 | 0.695649 | 3 | 0 | 3 |
| FRAT1 | EIF2AK3 | 0.693885 | 3 | 0 | 3 |
| FRAT1 | GNGT2 | 0.691211 | 4 | 0 | 3 |
| FRAT1 | UQCRFS1 | 0.691211 | 4 | 0 | 3 |
| FRAT1 | ABHD12 | 0.688668 | 3 | 0 | 3 |
| FRAT1 | CELF6 | 0.683475 | 3 | 0 | 3 |
| FRAT1 | ARAF | 0.682426 | 4 | 0 | 3 |
| FRAT1 | ZW10 | 0.679416 | 3 | 0 | 3 |
For details and further investigation, click here