| Full name: transmembrane protein 50A | Alias Symbol: SMP1 | ||
| Type: protein-coding gene | Cytoband: 1p36.11 | ||
| Entrez ID: 23585 | HGNC ID: HGNC:30590 | Ensembl Gene: ENSG00000183726 | OMIM ID: 605348 |
Expression of TMEM50A:
| Dataset | Gene | EntrezID | Probe | Log2FC | Adj.pValue | Expression |
|---|---|---|---|---|---|---|
| GSE17351 | TMEM50A | 23585 | 222401_s_at | -0.2288 | 0.5954 | |
| GSE20347 | TMEM50A | 23585 | 217766_s_at | -0.2987 | 0.0450 | |
| GSE23400 | TMEM50A | 23585 | 217766_s_at | 0.1493 | 0.0489 | |
| GSE26886 | TMEM50A | 23585 | 222401_s_at | -1.4090 | 0.0000 | |
| GSE29001 | TMEM50A | 23585 | 217766_s_at | -0.1368 | 0.5159 | |
| GSE38129 | TMEM50A | 23585 | 217766_s_at | -0.1802 | 0.0812 | |
| GSE45670 | TMEM50A | 23585 | 222401_s_at | -0.0970 | 0.5631 | |
| GSE53622 | TMEM50A | 23585 | 8491 | -0.0076 | 0.9161 | |
| GSE53624 | TMEM50A | 23585 | 4147 | 0.1085 | 0.2815 | |
| GSE63941 | TMEM50A | 23585 | 222401_s_at | -0.2203 | 0.5336 | |
| GSE77861 | TMEM50A | 23585 | 222401_s_at | -0.5486 | 0.0186 | |
| GSE97050 | TMEM50A | 23585 | A_24_P113824 | 0.2968 | 0.1857 | |
| SRP007169 | TMEM50A | 23585 | RNAseq | -1.0627 | 0.0041 | |
| SRP008496 | TMEM50A | 23585 | RNAseq | -0.9773 | 0.0000 | |
| SRP064894 | TMEM50A | 23585 | RNAseq | 0.0204 | 0.8739 | |
| SRP133303 | TMEM50A | 23585 | RNAseq | 0.3370 | 0.0438 | |
| SRP159526 | TMEM50A | 23585 | RNAseq | -0.3044 | 0.0179 | |
| SRP193095 | TMEM50A | 23585 | RNAseq | -0.2811 | 0.0154 | |
| SRP219564 | TMEM50A | 23585 | RNAseq | -0.5225 | 0.0117 | |
| TCGA | TMEM50A | 23585 | RNAseq | 0.0315 | 0.4690 |
Upregulated datasets: 0; Downregulated datasets: 2.
Survival by TMEM50A expression:
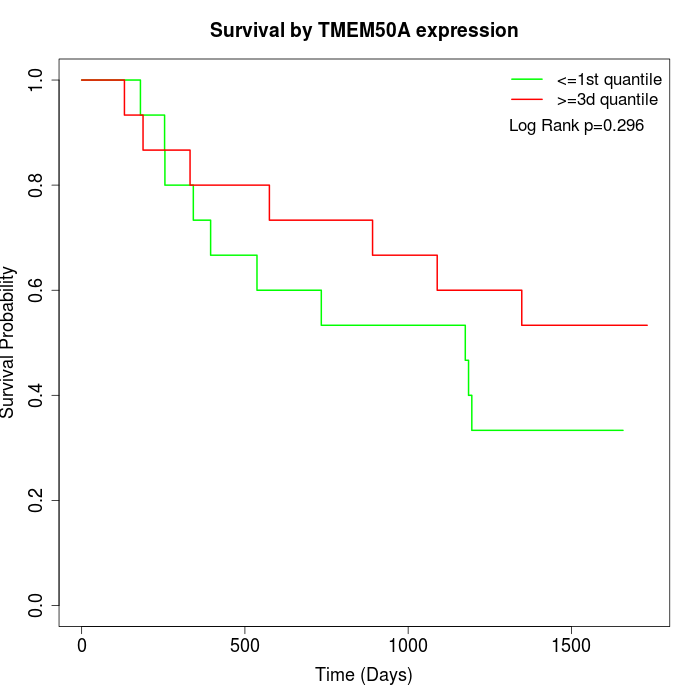 | 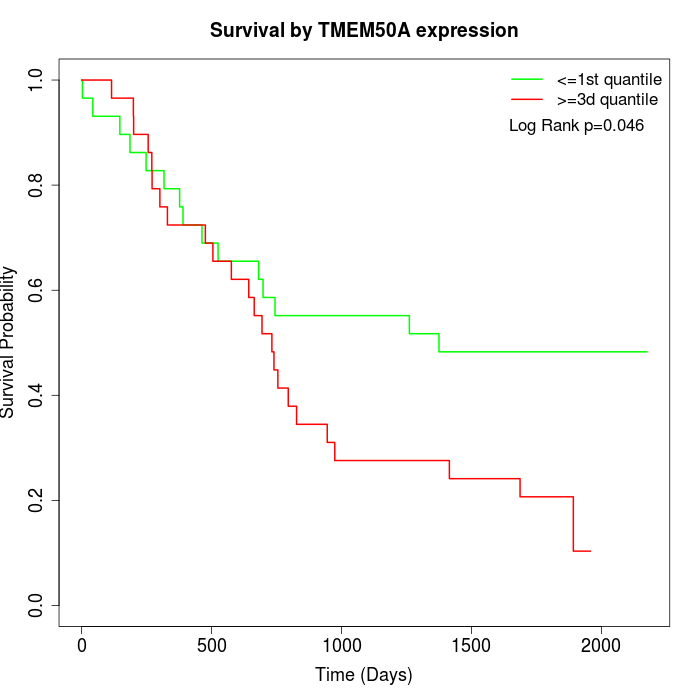 | 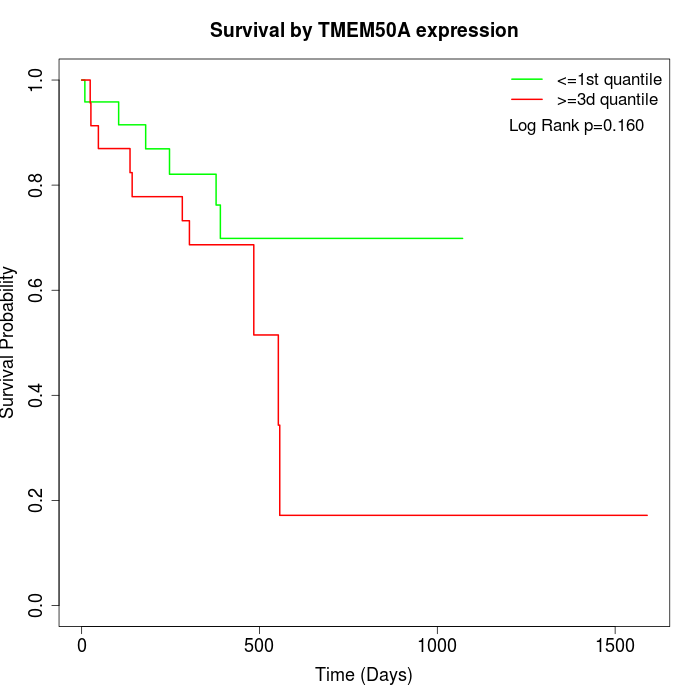 |
| GSE53622 | GSE53624 | TCGA |
Note: Click image to view full size file.
Copy number change of TMEM50A:
| Dataset | Gene | EntrezID | Gain | Loss | Normal | Detail |
|---|---|---|---|---|---|---|
| GSE15526 | TMEM50A | 23585 | 0 | 5 | 25 | |
| GSE20123 | TMEM50A | 23585 | 0 | 4 | 26 | |
| GSE43470 | TMEM50A | 23585 | 2 | 6 | 35 | |
| GSE46452 | TMEM50A | 23585 | 5 | 1 | 53 | |
| GSE47630 | TMEM50A | 23585 | 8 | 3 | 29 | |
| GSE54993 | TMEM50A | 23585 | 2 | 1 | 67 | |
| GSE54994 | TMEM50A | 23585 | 11 | 4 | 38 | |
| GSE60625 | TMEM50A | 23585 | 0 | 0 | 11 | |
| GSE74703 | TMEM50A | 23585 | 1 | 4 | 31 | |
| GSE74704 | TMEM50A | 23585 | 0 | 0 | 20 | |
| TCGA | TMEM50A | 23585 | 10 | 24 | 62 |
Total number of gains: 39; Total number of losses: 52; Total Number of normals: 397.
Somatic mutations of TMEM50A:
Generating mutation plots.
Highly correlated genes for TMEM50A:
Showing top 20/749 corelated genes with mean PCC>0.5.
| Gene1 | Gene2 | Mean PCC | Num. Datasets | Num. PCC<0 | Num. PCC>0.5 |
|---|---|---|---|---|---|
| TMEM50A | TPD52L2 | 0.826555 | 3 | 0 | 3 |
| TMEM50A | DNAJB9 | 0.815136 | 3 | 0 | 3 |
| TMEM50A | RPL41 | 0.78394 | 3 | 0 | 3 |
| TMEM50A | MAP3K8 | 0.781671 | 3 | 0 | 3 |
| TMEM50A | APEH | 0.774643 | 3 | 0 | 3 |
| TMEM50A | SACM1L | 0.772129 | 3 | 0 | 3 |
| TMEM50A | RRAGC | 0.771203 | 3 | 0 | 3 |
| TMEM50A | GIMAP8 | 0.769168 | 3 | 0 | 3 |
| TMEM50A | SEC22B | 0.764439 | 3 | 0 | 3 |
| TMEM50A | CNOT6L | 0.763922 | 4 | 0 | 4 |
| TMEM50A | ORMDL3 | 0.761474 | 3 | 0 | 3 |
| TMEM50A | ATF6 | 0.759442 | 3 | 0 | 3 |
| TMEM50A | EGLN1 | 0.7575 | 3 | 0 | 3 |
| TMEM50A | ARL2BP | 0.757404 | 3 | 0 | 3 |
| TMEM50A | OXNAD1 | 0.757095 | 3 | 0 | 3 |
| TMEM50A | ALAS1 | 0.754374 | 3 | 0 | 3 |
| TMEM50A | BRK1 | 0.753648 | 5 | 0 | 5 |
| TMEM50A | RCHY1 | 0.751669 | 3 | 0 | 3 |
| TMEM50A | BCAS2 | 0.750972 | 3 | 0 | 3 |
| TMEM50A | SLMAP | 0.746674 | 3 | 0 | 3 |
For details and further investigation, click here