| Full name: G protein subunit gamma transducin 2 | Alias Symbol: GNG9 | ||
| Type: protein-coding gene | Cytoband: 17q21 | ||
| Entrez ID: 2793 | HGNC ID: HGNC:4412 | Ensembl Gene: ENSG00000167083 | OMIM ID: 139391 |
GNGT2 involved pathways:
Expression of GNGT2:
| Dataset | Gene | EntrezID | Probe | Log2FC | Adj.pValue | Expression |
|---|---|---|---|---|---|---|
| GSE17351 | GNGT2 | 2793 | 235139_at | 0.0662 | 0.8690 | |
| GSE26886 | GNGT2 | 2793 | 235139_at | -0.1239 | 0.4447 | |
| GSE45670 | GNGT2 | 2793 | 235139_at | 0.0030 | 0.9799 | |
| GSE53622 | GNGT2 | 2793 | 18842 | -0.2018 | 0.1204 | |
| GSE53624 | GNGT2 | 2793 | 18842 | -0.0539 | 0.7594 | |
| GSE63941 | GNGT2 | 2793 | 235139_at | -0.1556 | 0.2814 | |
| GSE77861 | GNGT2 | 2793 | 235139_at | -0.1895 | 0.1193 | |
| GSE97050 | GNGT2 | 2793 | A_23_P26994 | 0.1755 | 0.3910 | |
| SRP133303 | GNGT2 | 2793 | RNAseq | -0.3165 | 0.3888 | |
| SRP159526 | GNGT2 | 2793 | RNAseq | -0.5483 | 0.4780 | |
| SRP219564 | GNGT2 | 2793 | RNAseq | 0.4867 | 0.4281 | |
| TCGA | GNGT2 | 2793 | RNAseq | 0.3413 | 0.1853 |
Upregulated datasets: 0; Downregulated datasets: 0.
Survival by GNGT2 expression:
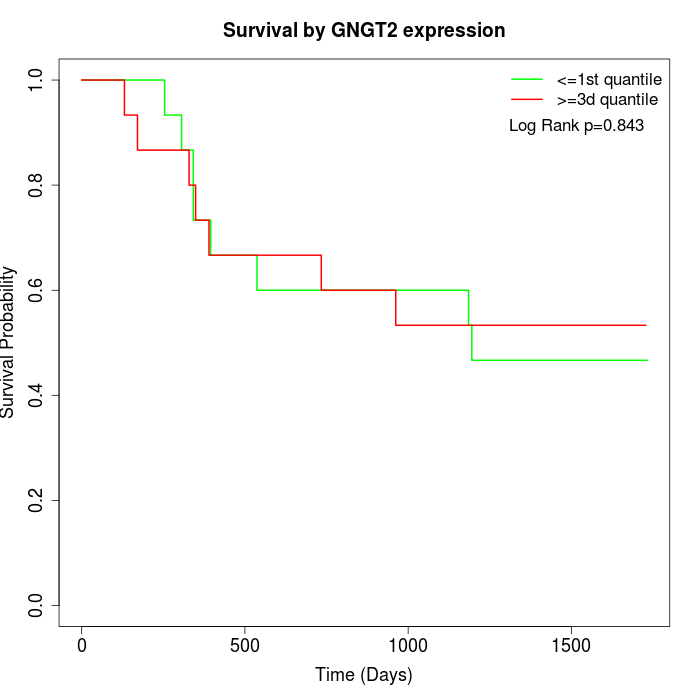 | 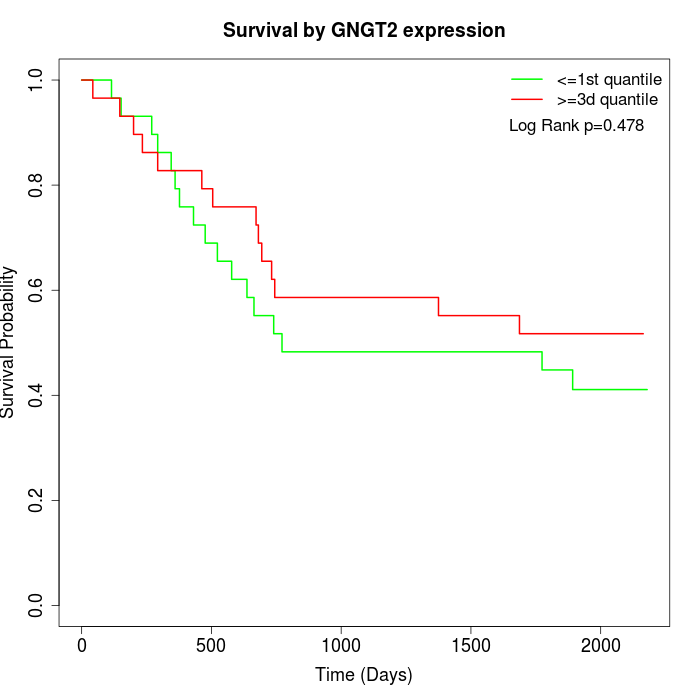 | 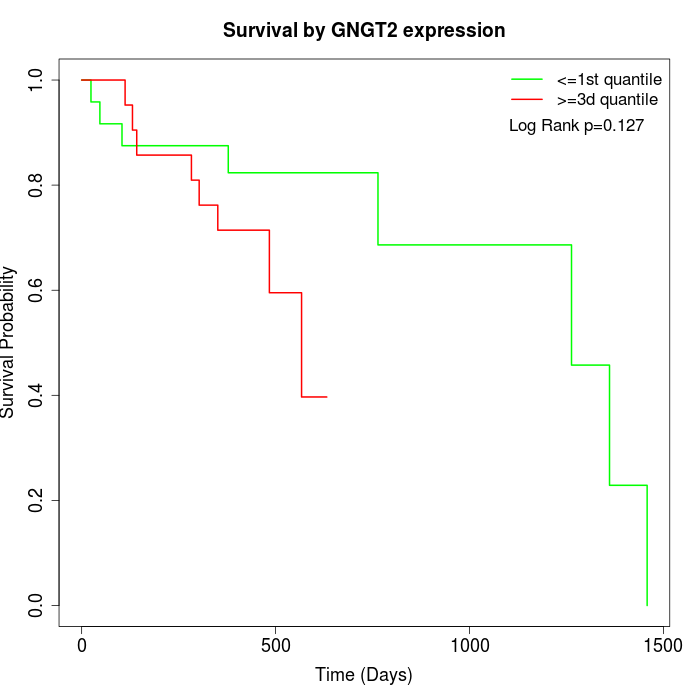 |
| GSE53622 | GSE53624 | TCGA |
Note: Click image to view full size file.
Copy number change of GNGT2:
| Dataset | Gene | EntrezID | Gain | Loss | Normal | Detail |
|---|---|---|---|---|---|---|
| GSE15526 | GNGT2 | 2793 | 6 | 2 | 22 | |
| GSE20123 | GNGT2 | 2793 | 6 | 2 | 22 | |
| GSE43470 | GNGT2 | 2793 | 3 | 2 | 38 | |
| GSE46452 | GNGT2 | 2793 | 32 | 0 | 27 | |
| GSE47630 | GNGT2 | 2793 | 9 | 0 | 31 | |
| GSE54993 | GNGT2 | 2793 | 2 | 4 | 64 | |
| GSE54994 | GNGT2 | 2793 | 10 | 6 | 37 | |
| GSE60625 | GNGT2 | 2793 | 4 | 0 | 7 | |
| GSE74703 | GNGT2 | 2793 | 3 | 2 | 31 | |
| GSE74704 | GNGT2 | 2793 | 4 | 1 | 15 | |
| TCGA | GNGT2 | 2793 | 27 | 7 | 62 |
Total number of gains: 106; Total number of losses: 26; Total Number of normals: 356.
Somatic mutations of GNGT2:
Generating mutation plots.
Highly correlated genes for GNGT2:
Showing top 20/364 corelated genes with mean PCC>0.5.
| Gene1 | Gene2 | Mean PCC | Num. Datasets | Num. PCC<0 | Num. PCC>0.5 |
|---|---|---|---|---|---|
| GNGT2 | PDE4B | 0.812344 | 3 | 0 | 3 |
| GNGT2 | KCNAB2 | 0.801937 | 3 | 0 | 3 |
| GNGT2 | ITGAM | 0.796036 | 3 | 0 | 3 |
| GNGT2 | IL2RB | 0.794732 | 3 | 0 | 3 |
| GNGT2 | CST7 | 0.781248 | 5 | 0 | 5 |
| GNGT2 | RHOH | 0.774736 | 4 | 0 | 4 |
| GNGT2 | SNX12 | 0.773302 | 3 | 0 | 3 |
| GNGT2 | SH3BP5 | 0.772777 | 3 | 0 | 3 |
| GNGT2 | TRAT1 | 0.764987 | 3 | 0 | 3 |
| GNGT2 | PIK3CG | 0.760482 | 3 | 0 | 3 |
| GNGT2 | CLDND2 | 0.755097 | 3 | 0 | 3 |
| GNGT2 | C16orf54 | 0.751829 | 4 | 0 | 4 |
| GNGT2 | MPP1 | 0.749035 | 3 | 0 | 3 |
| GNGT2 | SNX20 | 0.748903 | 5 | 0 | 5 |
| GNGT2 | CCL5 | 0.748462 | 4 | 0 | 4 |
| GNGT2 | FLI1 | 0.747938 | 4 | 0 | 4 |
| GNGT2 | PTPN22 | 0.746991 | 3 | 0 | 3 |
| GNGT2 | BNIP1 | 0.746055 | 3 | 0 | 3 |
| GNGT2 | SPI1 | 0.740762 | 5 | 0 | 5 |
| GNGT2 | DCTN3 | 0.731977 | 3 | 0 | 3 |
For details and further investigation, click here