| Full name: glycerophosphodiester phosphodiesterase 1 | Alias Symbol: MIR16 | ||
| Type: protein-coding gene | Cytoband: 16p12.3 | ||
| Entrez ID: 51573 | HGNC ID: HGNC:29644 | Ensembl Gene: ENSG00000006007 | OMIM ID: 605943 |
Expression of GDE1:
| Dataset | Gene | EntrezID | Probe | Log2FC | Adj.pValue | Expression |
|---|---|---|---|---|---|---|
| GSE17351 | GDE1 | 51573 | 226214_at | -0.0457 | 0.9508 | |
| GSE20347 | GDE1 | 51573 | 202593_s_at | -0.2261 | 0.3591 | |
| GSE23400 | GDE1 | 51573 | 202593_s_at | 0.0399 | 0.7215 | |
| GSE26886 | GDE1 | 51573 | 226214_at | 1.1082 | 0.0000 | |
| GSE29001 | GDE1 | 51573 | 202593_s_at | -0.0243 | 0.9517 | |
| GSE38129 | GDE1 | 51573 | 202593_s_at | -0.0430 | 0.8654 | |
| GSE45670 | GDE1 | 51573 | 226214_at | 0.1750 | 0.2266 | |
| GSE53622 | GDE1 | 51573 | 3637 | -0.0020 | 0.9829 | |
| GSE53624 | GDE1 | 51573 | 3637 | 0.0059 | 0.9405 | |
| GSE63941 | GDE1 | 51573 | 202593_s_at | 0.4380 | 0.3869 | |
| GSE77861 | GDE1 | 51573 | 226214_at | 0.2171 | 0.3531 | |
| GSE97050 | GDE1 | 51573 | A_23_P54758 | -0.0678 | 0.8396 | |
| SRP007169 | GDE1 | 51573 | RNAseq | -0.2968 | 0.3148 | |
| SRP008496 | GDE1 | 51573 | RNAseq | -0.2691 | 0.0543 | |
| SRP064894 | GDE1 | 51573 | RNAseq | -0.1833 | 0.3342 | |
| SRP133303 | GDE1 | 51573 | RNAseq | 0.4440 | 0.0139 | |
| SRP159526 | GDE1 | 51573 | RNAseq | -0.0780 | 0.7835 | |
| SRP193095 | GDE1 | 51573 | RNAseq | 0.0071 | 0.9542 | |
| SRP219564 | GDE1 | 51573 | RNAseq | -0.4901 | 0.3524 | |
| TCGA | GDE1 | 51573 | RNAseq | -0.1558 | 0.0004 |
Upregulated datasets: 1; Downregulated datasets: 0.
Survival by GDE1 expression:
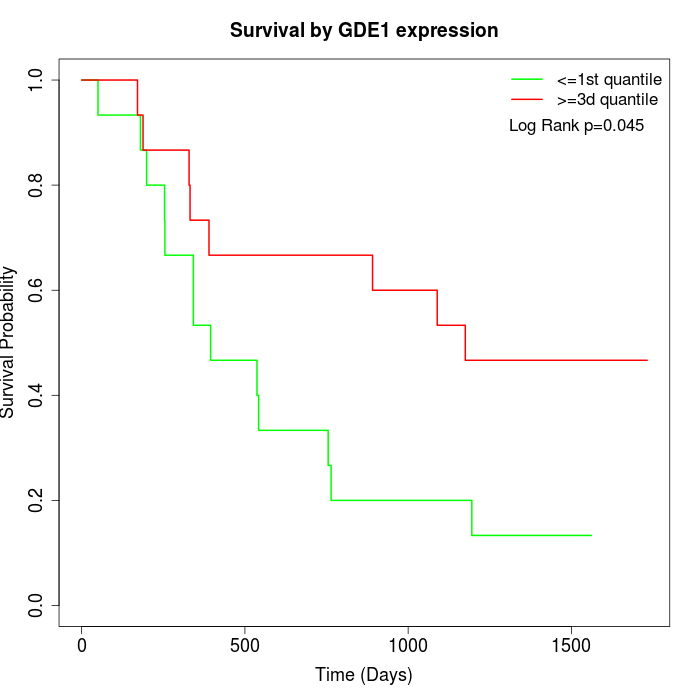 | 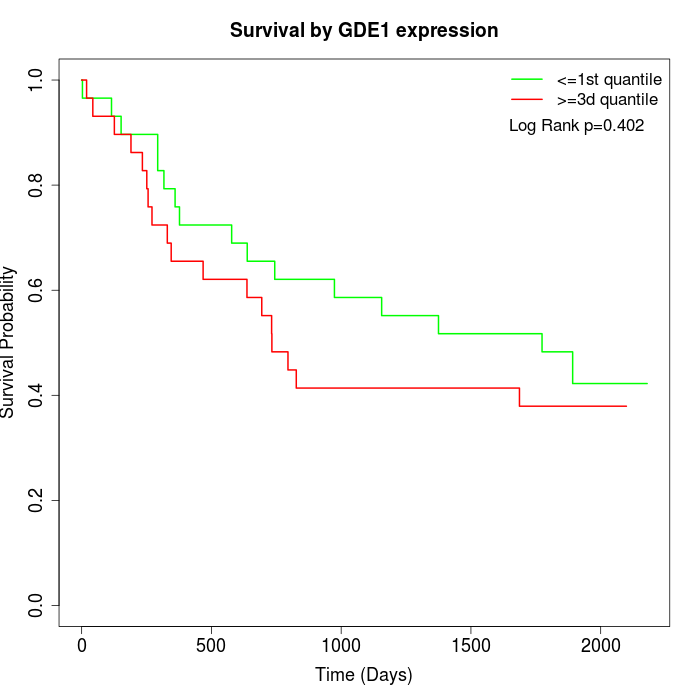 | 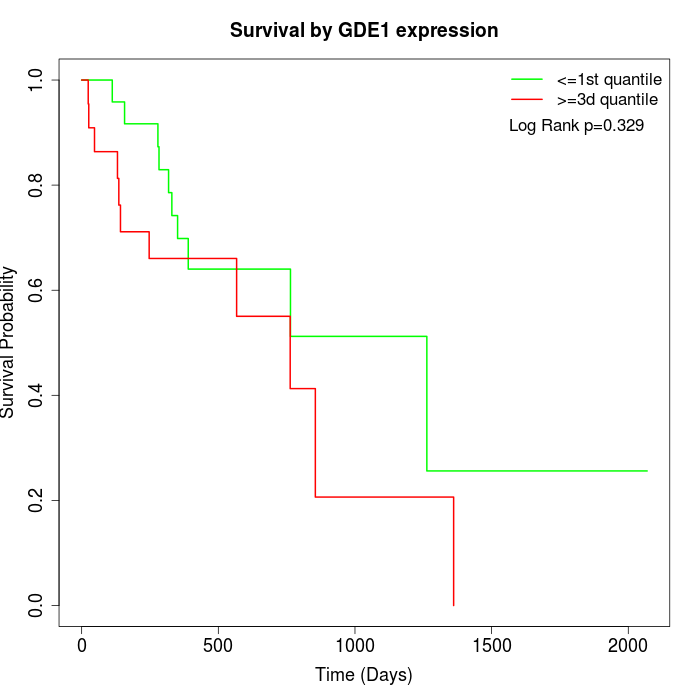 |
| GSE53622 | GSE53624 | TCGA |
Note: Click image to view full size file.
Copy number change of GDE1:
| Dataset | Gene | EntrezID | Gain | Loss | Normal | Detail |
|---|---|---|---|---|---|---|
| GSE15526 | GDE1 | 51573 | 6 | 3 | 21 | |
| GSE20123 | GDE1 | 51573 | 6 | 2 | 22 | |
| GSE43470 | GDE1 | 51573 | 3 | 3 | 37 | |
| GSE46452 | GDE1 | 51573 | 38 | 1 | 20 | |
| GSE47630 | GDE1 | 51573 | 11 | 6 | 23 | |
| GSE54993 | GDE1 | 51573 | 3 | 5 | 62 | |
| GSE54994 | GDE1 | 51573 | 3 | 10 | 40 | |
| GSE60625 | GDE1 | 51573 | 4 | 0 | 7 | |
| GSE74703 | GDE1 | 51573 | 3 | 2 | 31 | |
| GSE74704 | GDE1 | 51573 | 3 | 1 | 16 | |
| TCGA | GDE1 | 51573 | 21 | 12 | 63 |
Total number of gains: 101; Total number of losses: 45; Total Number of normals: 342.
Somatic mutations of GDE1:
Generating mutation plots.
Highly correlated genes for GDE1:
Showing top 20/554 corelated genes with mean PCC>0.5.
| Gene1 | Gene2 | Mean PCC | Num. Datasets | Num. PCC<0 | Num. PCC>0.5 |
|---|---|---|---|---|---|
| GDE1 | ZNF558 | 0.816132 | 3 | 0 | 3 |
| GDE1 | TCHP | 0.799727 | 3 | 0 | 3 |
| GDE1 | MRPS18A | 0.780462 | 3 | 0 | 3 |
| GDE1 | TMED8 | 0.761618 | 3 | 0 | 3 |
| GDE1 | POC5 | 0.759289 | 3 | 0 | 3 |
| GDE1 | USP24 | 0.753654 | 3 | 0 | 3 |
| GDE1 | MED29 | 0.751801 | 3 | 0 | 3 |
| GDE1 | PET117 | 0.745099 | 3 | 0 | 3 |
| GDE1 | PIGX | 0.743273 | 3 | 0 | 3 |
| GDE1 | TOPBP1 | 0.741008 | 3 | 0 | 3 |
| GDE1 | COG1 | 0.735509 | 3 | 0 | 3 |
| GDE1 | DDB1 | 0.729874 | 3 | 0 | 3 |
| GDE1 | PIGM | 0.728346 | 3 | 0 | 3 |
| GDE1 | GNS | 0.72688 | 4 | 0 | 3 |
| GDE1 | NKAP | 0.72572 | 3 | 0 | 3 |
| GDE1 | NOL9 | 0.722047 | 4 | 0 | 3 |
| GDE1 | UHRF1BP1 | 0.72081 | 4 | 0 | 4 |
| GDE1 | TPRKB | 0.717905 | 4 | 0 | 3 |
| GDE1 | MIF4GD | 0.715623 | 3 | 0 | 3 |
| GDE1 | TRMT6 | 0.712796 | 3 | 0 | 3 |
For details and further investigation, click here