| Full name: DNA topoisomerase II binding protein 1 | Alias Symbol: KIAA0259|TOP2BP1|Dpb11 | ||
| Type: protein-coding gene | Cytoband: 3q22.1 | ||
| Entrez ID: 11073 | HGNC ID: HGNC:17008 | Ensembl Gene: ENSG00000163781 | OMIM ID: 607760 |
Screen Evidence:
| |||
Expression of TOPBP1:
| Dataset | Gene | EntrezID | Probe | Log2FC | Adj.pValue | Expression |
|---|---|---|---|---|---|---|
| GSE17351 | TOPBP1 | 11073 | 202633_at | 0.9484 | 0.0523 | |
| GSE20347 | TOPBP1 | 11073 | 202633_at | 1.2030 | 0.0000 | |
| GSE23400 | TOPBP1 | 11073 | 202633_at | 1.2242 | 0.0000 | |
| GSE26886 | TOPBP1 | 11073 | 202633_at | 0.8791 | 0.0005 | |
| GSE29001 | TOPBP1 | 11073 | 202633_at | 1.3006 | 0.0014 | |
| GSE38129 | TOPBP1 | 11073 | 202633_at | 1.2725 | 0.0000 | |
| GSE45670 | TOPBP1 | 11073 | 202633_at | 0.6694 | 0.0035 | |
| GSE53622 | TOPBP1 | 11073 | 4687 | 1.0521 | 0.0000 | |
| GSE53624 | TOPBP1 | 11073 | 4687 | 1.1173 | 0.0000 | |
| GSE63941 | TOPBP1 | 11073 | 202633_at | 1.3497 | 0.0021 | |
| GSE77861 | TOPBP1 | 11073 | 202633_at | 0.9027 | 0.0286 | |
| GSE97050 | TOPBP1 | 11073 | A_23_P159390 | 1.0249 | 0.0796 | |
| SRP007169 | TOPBP1 | 11073 | RNAseq | 2.2344 | 0.0000 | |
| SRP008496 | TOPBP1 | 11073 | RNAseq | 2.3530 | 0.0000 | |
| SRP064894 | TOPBP1 | 11073 | RNAseq | 0.7360 | 0.0034 | |
| SRP133303 | TOPBP1 | 11073 | RNAseq | 0.9222 | 0.0000 | |
| SRP159526 | TOPBP1 | 11073 | RNAseq | 1.2274 | 0.0009 | |
| SRP193095 | TOPBP1 | 11073 | RNAseq | 0.8250 | 0.0000 | |
| SRP219564 | TOPBP1 | 11073 | RNAseq | 0.6221 | 0.1134 | |
| TCGA | TOPBP1 | 11073 | RNAseq | 0.3523 | 0.0000 |
Upregulated datasets: 10; Downregulated datasets: 0.
Survival by TOPBP1 expression:
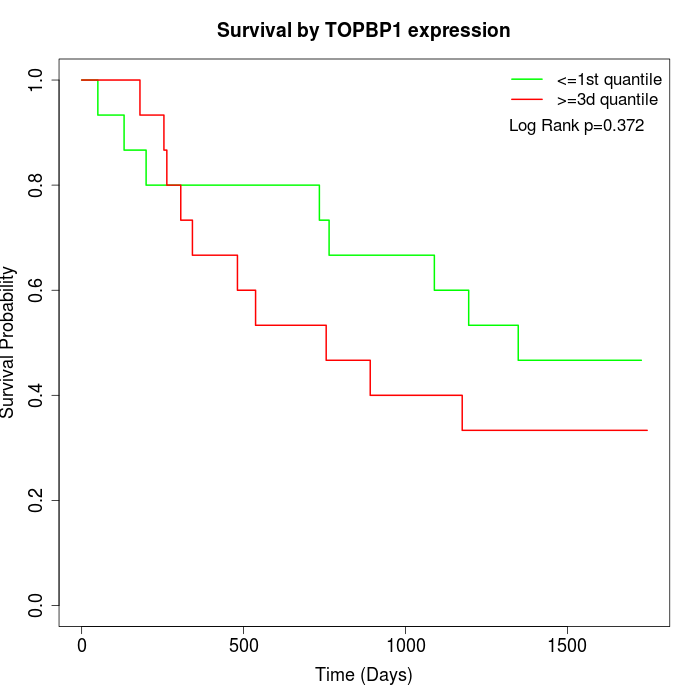 | 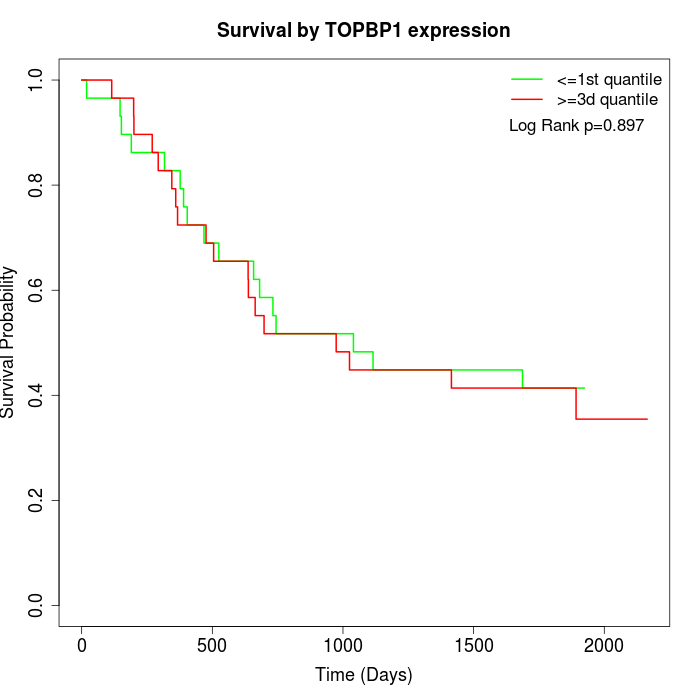 | 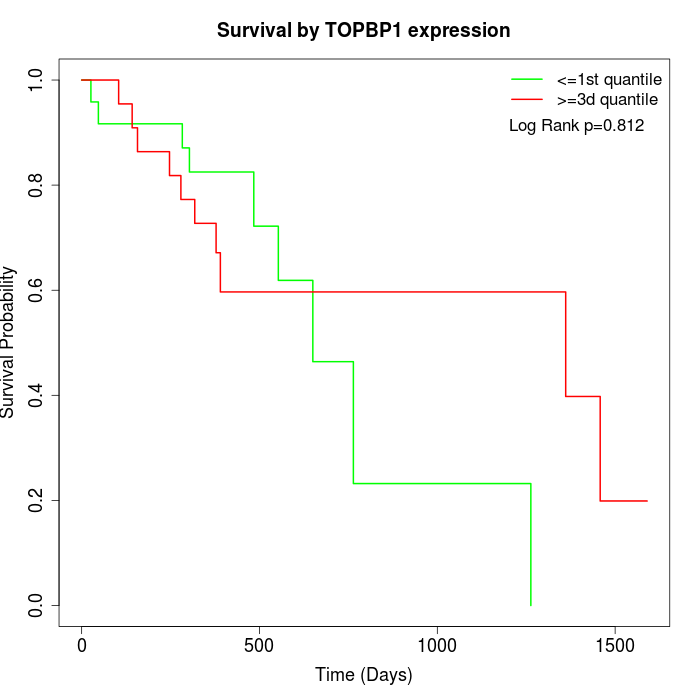 |
| GSE53622 | GSE53624 | TCGA |
Note: Click image to view full size file.
Copy number change of TOPBP1:
| Dataset | Gene | EntrezID | Gain | Loss | Normal | Detail |
|---|---|---|---|---|---|---|
| GSE15526 | TOPBP1 | 11073 | 16 | 0 | 14 | |
| GSE20123 | TOPBP1 | 11073 | 16 | 0 | 14 | |
| GSE43470 | TOPBP1 | 11073 | 21 | 0 | 22 | |
| GSE46452 | TOPBP1 | 11073 | 15 | 4 | 40 | |
| GSE47630 | TOPBP1 | 11073 | 18 | 3 | 19 | |
| GSE54993 | TOPBP1 | 11073 | 2 | 8 | 60 | |
| GSE54994 | TOPBP1 | 11073 | 32 | 1 | 20 | |
| GSE60625 | TOPBP1 | 11073 | 0 | 6 | 5 | |
| GSE74703 | TOPBP1 | 11073 | 18 | 0 | 18 | |
| GSE74704 | TOPBP1 | 11073 | 11 | 0 | 9 | |
| TCGA | TOPBP1 | 11073 | 59 | 5 | 32 |
Total number of gains: 208; Total number of losses: 27; Total Number of normals: 253.
Somatic mutations of TOPBP1:
Generating mutation plots.
Highly correlated genes for TOPBP1:
Showing top 20/2064 corelated genes with mean PCC>0.5.
| Gene1 | Gene2 | Mean PCC | Num. Datasets | Num. PCC<0 | Num. PCC>0.5 |
|---|---|---|---|---|---|
| TOPBP1 | AP3D1 | 0.832226 | 3 | 0 | 3 |
| TOPBP1 | ATR | 0.8164 | 12 | 0 | 11 |
| TOPBP1 | ATP2C1 | 0.811933 | 12 | 0 | 12 |
| TOPBP1 | U2SURP | 0.811543 | 10 | 0 | 10 |
| TOPBP1 | GMPS | 0.805156 | 12 | 0 | 12 |
| TOPBP1 | ECT2 | 0.800536 | 12 | 0 | 12 |
| TOPBP1 | MCM2 | 0.798396 | 12 | 0 | 12 |
| TOPBP1 | TIMELESS | 0.791911 | 12 | 0 | 12 |
| TOPBP1 | ACTL6A | 0.788692 | 13 | 0 | 12 |
| TOPBP1 | HPS3 | 0.786361 | 5 | 0 | 5 |
| TOPBP1 | UMPS | 0.784659 | 11 | 0 | 11 |
| TOPBP1 | RACGAP1 | 0.781088 | 10 | 0 | 10 |
| TOPBP1 | PIK3R4 | 0.780807 | 12 | 0 | 11 |
| TOPBP1 | RFC4 | 0.780413 | 13 | 0 | 13 |
| TOPBP1 | UCK2 | 0.779931 | 3 | 0 | 3 |
| TOPBP1 | MMS22L | 0.777354 | 3 | 0 | 3 |
| TOPBP1 | GTF2E1 | 0.772228 | 10 | 0 | 10 |
| TOPBP1 | RUVBL1 | 0.767217 | 12 | 0 | 12 |
| TOPBP1 | ATAD2 | 0.767014 | 12 | 0 | 11 |
| TOPBP1 | CDC42SE2 | 0.765244 | 3 | 0 | 3 |
For details and further investigation, click here