| Full name: trichoplein keratin filament binding | Alias Symbol: MGC10854|TpMs | ||
| Type: protein-coding gene | Cytoband: 12q24.11 | ||
| Entrez ID: 84260 | HGNC ID: HGNC:28135 | Ensembl Gene: ENSG00000139437 | OMIM ID: 612654 |
Expression of TCHP:
| Dataset | Gene | EntrezID | Probe | Log2FC | Adj.pValue | Expression |
|---|---|---|---|---|---|---|
| GSE17351 | TCHP | 84260 | 223455_at | -0.1640 | 0.8151 | |
| GSE26886 | TCHP | 84260 | 223455_at | -0.3617 | 0.0794 | |
| GSE45670 | TCHP | 84260 | 223455_at | -0.1090 | 0.5879 | |
| GSE53622 | TCHP | 84260 | 15895 | -0.0008 | 0.9920 | |
| GSE53624 | TCHP | 84260 | 51805 | -0.3138 | 0.0000 | |
| GSE63941 | TCHP | 84260 | 223455_at | 0.1520 | 0.6958 | |
| GSE77861 | TCHP | 84260 | 223455_at | 0.1737 | 0.6227 | |
| GSE97050 | TCHP | 84260 | A_23_P151159 | 0.2035 | 0.4151 | |
| SRP007169 | TCHP | 84260 | RNAseq | 0.1802 | 0.7603 | |
| SRP064894 | TCHP | 84260 | RNAseq | -0.6818 | 0.0000 | |
| SRP133303 | TCHP | 84260 | RNAseq | -0.3703 | 0.0219 | |
| SRP159526 | TCHP | 84260 | RNAseq | -0.3448 | 0.1803 | |
| SRP193095 | TCHP | 84260 | RNAseq | -0.2664 | 0.0984 | |
| SRP219564 | TCHP | 84260 | RNAseq | -1.1196 | 0.0002 | |
| TCGA | TCHP | 84260 | RNAseq | 0.0060 | 0.9226 |
Upregulated datasets: 0; Downregulated datasets: 1.
Survival by TCHP expression:
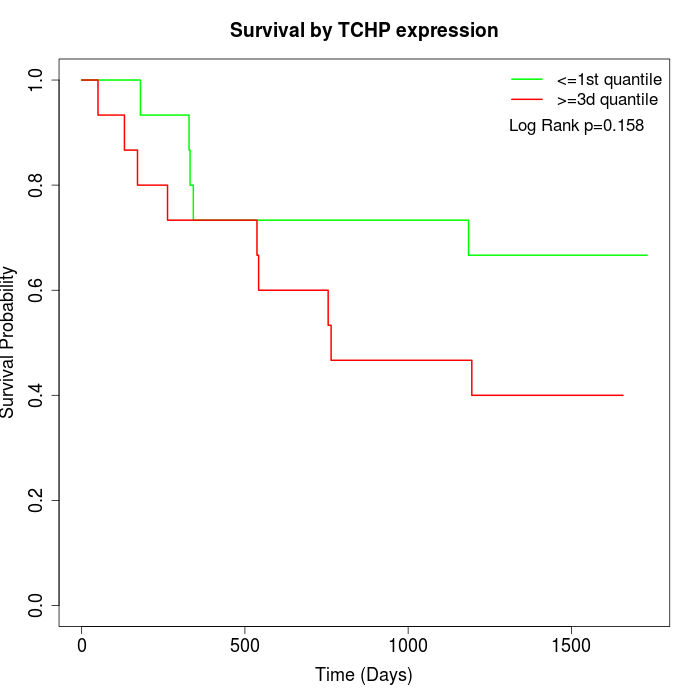 | 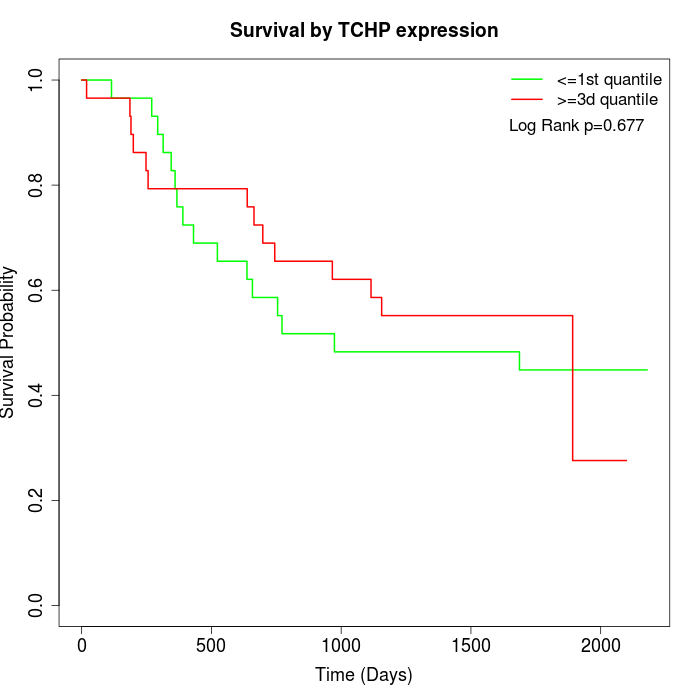 | 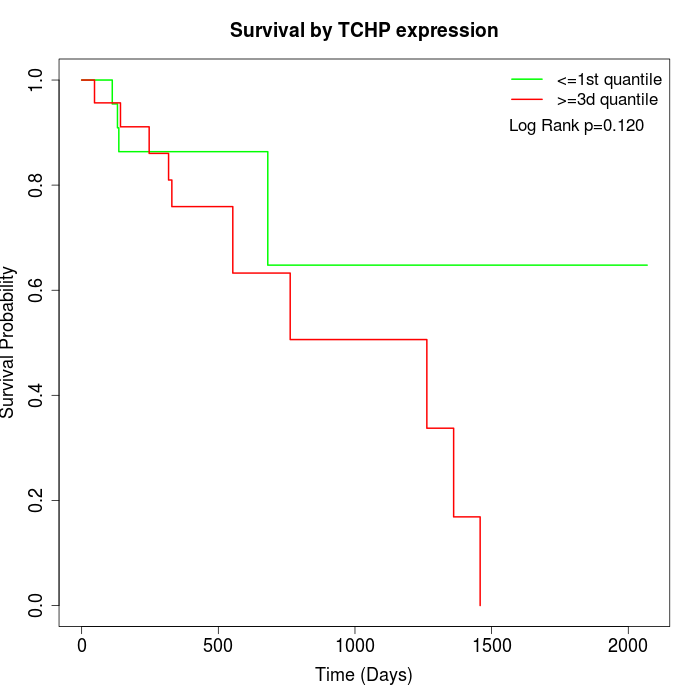 |
| GSE53622 | GSE53624 | TCGA |
Note: Click image to view full size file.
Copy number change of TCHP:
| Dataset | Gene | EntrezID | Gain | Loss | Normal | Detail |
|---|---|---|---|---|---|---|
| GSE15526 | TCHP | 84260 | 5 | 3 | 22 | |
| GSE20123 | TCHP | 84260 | 5 | 3 | 22 | |
| GSE43470 | TCHP | 84260 | 2 | 1 | 40 | |
| GSE46452 | TCHP | 84260 | 9 | 1 | 49 | |
| GSE47630 | TCHP | 84260 | 9 | 1 | 30 | |
| GSE54993 | TCHP | 84260 | 0 | 5 | 65 | |
| GSE54994 | TCHP | 84260 | 4 | 3 | 46 | |
| GSE60625 | TCHP | 84260 | 0 | 0 | 11 | |
| GSE74703 | TCHP | 84260 | 2 | 0 | 34 | |
| GSE74704 | TCHP | 84260 | 2 | 2 | 16 | |
| TCGA | TCHP | 84260 | 22 | 10 | 64 |
Total number of gains: 60; Total number of losses: 29; Total Number of normals: 399.
Somatic mutations of TCHP:
Generating mutation plots.
Highly correlated genes for TCHP:
Showing top 20/197 corelated genes with mean PCC>0.5.
| Gene1 | Gene2 | Mean PCC | Num. Datasets | Num. PCC<0 | Num. PCC>0.5 |
|---|---|---|---|---|---|
| TCHP | ZFC3H1 | 0.807167 | 3 | 0 | 3 |
| TCHP | GDE1 | 0.799727 | 3 | 0 | 3 |
| TCHP | PTPRA | 0.779409 | 3 | 0 | 3 |
| TCHP | ZMPSTE24 | 0.759001 | 3 | 0 | 3 |
| TCHP | ZNHIT6 | 0.754723 | 3 | 0 | 3 |
| TCHP | PDZD8 | 0.742296 | 3 | 0 | 3 |
| TCHP | MYSM1 | 0.740937 | 3 | 0 | 3 |
| TCHP | MAPK1 | 0.740173 | 3 | 0 | 3 |
| TCHP | PRPF38A | 0.737569 | 3 | 0 | 3 |
| TCHP | MBNL3 | 0.734839 | 3 | 0 | 3 |
| TCHP | THAP2 | 0.725296 | 3 | 0 | 3 |
| TCHP | COX10 | 0.723835 | 3 | 0 | 3 |
| TCHP | TASP1 | 0.722988 | 3 | 0 | 3 |
| TCHP | SYPL1 | 0.720254 | 3 | 0 | 3 |
| TCHP | TRAFD1 | 0.719007 | 3 | 0 | 3 |
| TCHP | MALT1 | 0.718638 | 3 | 0 | 3 |
| TCHP | TUFM | 0.717577 | 4 | 0 | 4 |
| TCHP | HINT3 | 0.71392 | 3 | 0 | 3 |
| TCHP | TMEM186 | 0.70572 | 4 | 0 | 3 |
| TCHP | RNLS | 0.705039 | 3 | 0 | 3 |
For details and further investigation, click here