| Full name: phosphatidylinositol glycan anchor biosynthesis class X | Alias Symbol: FLJ20522 | ||
| Type: protein-coding gene | Cytoband: 3q29 | ||
| Entrez ID: 54965 | HGNC ID: HGNC:26046 | Ensembl Gene: ENSG00000163964 | OMIM ID: 610276 |
Expression of PIGX:
| Dataset | Gene | EntrezID | Probe | Log2FC | Adj.pValue | Expression |
|---|---|---|---|---|---|---|
| GSE17351 | PIGX | 54965 | 1563111_a_at | 1.1121 | 0.1551 | |
| GSE26886 | PIGX | 54965 | 1552291_at | 1.3680 | 0.0001 | |
| GSE45670 | PIGX | 54965 | 1563111_a_at | 1.2455 | 0.0003 | |
| GSE53622 | PIGX | 54965 | 61950 | 0.4662 | 0.0000 | |
| GSE53624 | PIGX | 54965 | 61950 | 0.9396 | 0.0000 | |
| GSE63941 | PIGX | 54965 | 1563111_a_at | 1.6786 | 0.0025 | |
| GSE77861 | PIGX | 54965 | 1563111_a_at | 1.3747 | 0.0102 | |
| GSE97050 | PIGX | 54965 | A_33_P3242388 | 0.0277 | 0.9553 | |
| SRP007169 | PIGX | 54965 | RNAseq | 1.0963 | 0.0041 | |
| SRP008496 | PIGX | 54965 | RNAseq | 1.2125 | 0.0003 | |
| SRP064894 | PIGX | 54965 | RNAseq | 0.9688 | 0.0000 | |
| SRP133303 | PIGX | 54965 | RNAseq | 1.0367 | 0.0006 | |
| SRP159526 | PIGX | 54965 | RNAseq | 1.8034 | 0.0000 | |
| SRP193095 | PIGX | 54965 | RNAseq | 1.2569 | 0.0000 | |
| SRP219564 | PIGX | 54965 | RNAseq | 0.5633 | 0.2183 | |
| TCGA | PIGX | 54965 | RNAseq | 0.3265 | 0.0000 |
Upregulated datasets: 9; Downregulated datasets: 0.
Survival by PIGX expression:
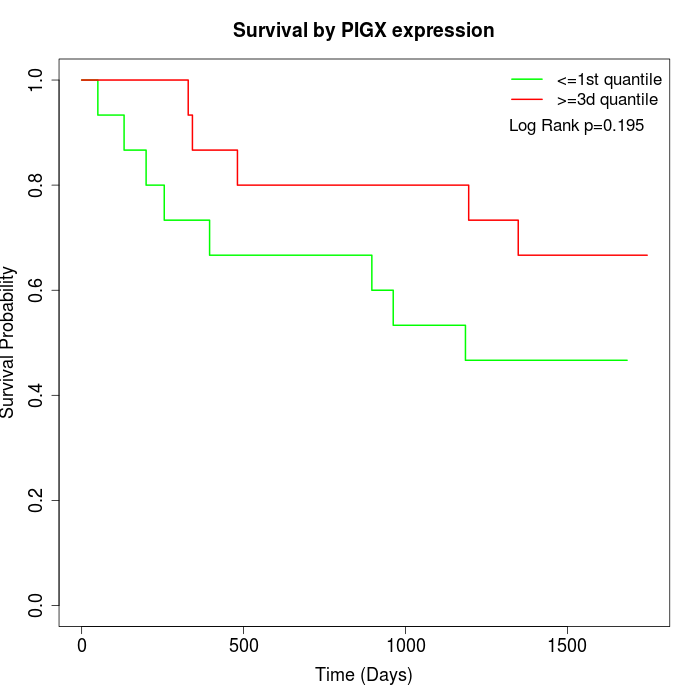 | 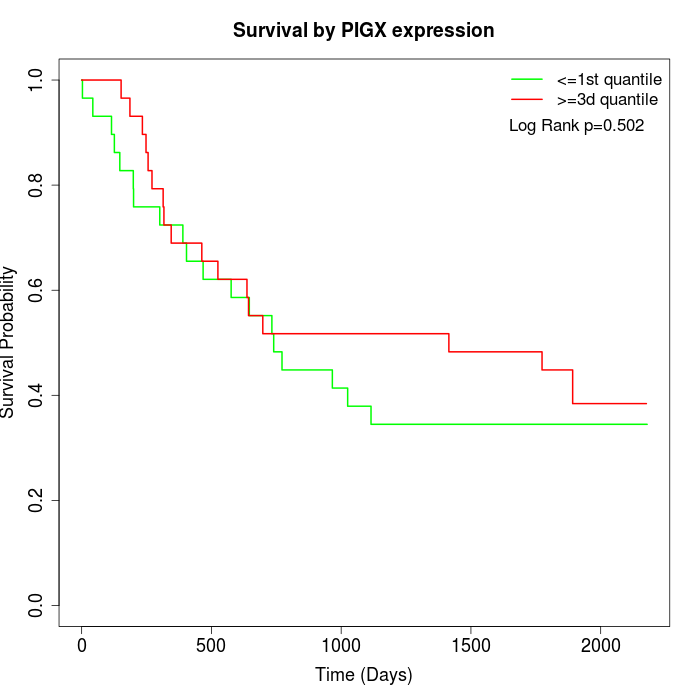 | 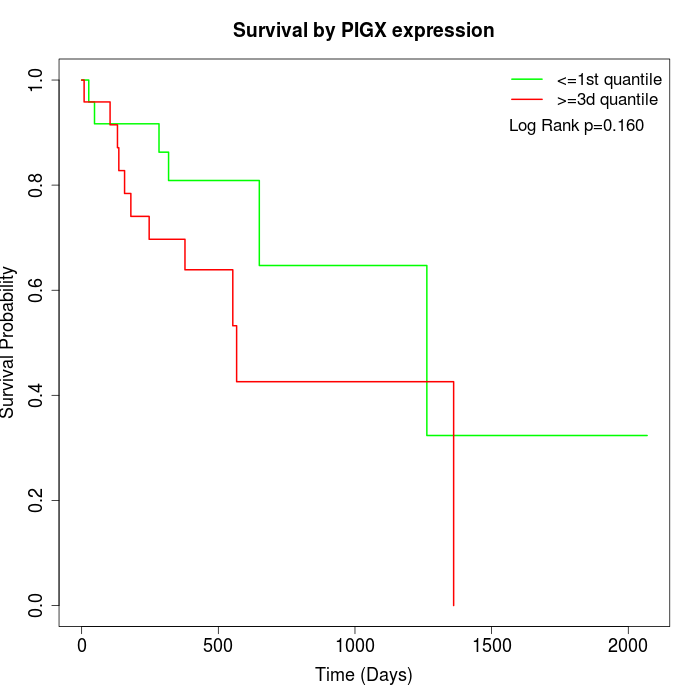 |
| GSE53622 | GSE53624 | TCGA |
Note: Click image to view full size file.
Copy number change of PIGX:
| Dataset | Gene | EntrezID | Gain | Loss | Normal | Detail |
|---|---|---|---|---|---|---|
| GSE15526 | PIGX | 54965 | 22 | 0 | 8 | |
| GSE20123 | PIGX | 54965 | 22 | 0 | 8 | |
| GSE43470 | PIGX | 54965 | 21 | 0 | 22 | |
| GSE46452 | PIGX | 54965 | 19 | 1 | 39 | |
| GSE47630 | PIGX | 54965 | 27 | 2 | 11 | |
| GSE54993 | PIGX | 54965 | 1 | 22 | 47 | |
| GSE54994 | PIGX | 54965 | 41 | 0 | 12 | |
| GSE60625 | PIGX | 54965 | 0 | 6 | 5 | |
| GSE74703 | PIGX | 54965 | 19 | 0 | 17 | |
| GSE74704 | PIGX | 54965 | 14 | 0 | 6 | |
| TCGA | PIGX | 54965 | 76 | 1 | 19 |
Total number of gains: 262; Total number of losses: 32; Total Number of normals: 194.
Somatic mutations of PIGX:
Generating mutation plots.
Highly correlated genes for PIGX:
Showing top 20/1119 corelated genes with mean PCC>0.5.
| Gene1 | Gene2 | Mean PCC | Num. Datasets | Num. PCC<0 | Num. PCC>0.5 |
|---|---|---|---|---|---|
| PIGX | ATG10 | 0.884664 | 3 | 0 | 3 |
| PIGX | COQ7 | 0.775846 | 3 | 0 | 3 |
| PIGX | LRP5L | 0.772716 | 3 | 0 | 3 |
| PIGX | MRPL47 | 0.762132 | 8 | 0 | 8 |
| PIGX | FH | 0.756892 | 4 | 0 | 4 |
| PIGX | INPP5B | 0.751075 | 3 | 0 | 3 |
| PIGX | IMMP1L | 0.750765 | 3 | 0 | 3 |
| PIGX | SLC4A2 | 0.750629 | 3 | 0 | 3 |
| PIGX | ALKBH6 | 0.750112 | 4 | 0 | 4 |
| PIGX | ABCB6 | 0.747223 | 3 | 0 | 3 |
| PIGX | LRIF1 | 0.745968 | 3 | 0 | 3 |
| PIGX | FAM32A | 0.745679 | 3 | 0 | 3 |
| PIGX | SRSF7 | 0.744949 | 4 | 0 | 4 |
| PIGX | EHD1 | 0.743355 | 3 | 0 | 3 |
| PIGX | GDE1 | 0.743273 | 3 | 0 | 3 |
| PIGX | ZBED1 | 0.742933 | 3 | 0 | 3 |
| PIGX | SLC4A5 | 0.73726 | 3 | 0 | 3 |
| PIGX | ATP13A3 | 0.734657 | 7 | 0 | 7 |
| PIGX | GOLIM4 | 0.733048 | 5 | 0 | 4 |
| PIGX | KLF13 | 0.732117 | 4 | 0 | 3 |
For details and further investigation, click here