| Full name: glucuronic acid epimerase | Alias Symbol: KIAA0836|HSEPI | ||
| Type: protein-coding gene | Cytoband: 15q23 | ||
| Entrez ID: 26035 | HGNC ID: HGNC:17855 | Ensembl Gene: ENSG00000138604 | OMIM ID: 612134 |
Expression of GLCE:
| Dataset | Gene | EntrezID | Probe | Log2FC | Adj.pValue | Expression |
|---|---|---|---|---|---|---|
| GSE17351 | GLCE | 26035 | 213552_at | -0.4752 | 0.6150 | |
| GSE20347 | GLCE | 26035 | 213552_at | -0.8310 | 0.0007 | |
| GSE23400 | GLCE | 26035 | 213552_at | -0.2286 | 0.0005 | |
| GSE26886 | GLCE | 26035 | 213552_at | -0.8358 | 0.0021 | |
| GSE29001 | GLCE | 26035 | 213552_at | -1.1507 | 0.0007 | |
| GSE38129 | GLCE | 26035 | 213552_at | -0.3496 | 0.1322 | |
| GSE45670 | GLCE | 26035 | 213552_at | -0.3522 | 0.0182 | |
| GSE53622 | GLCE | 26035 | 49365 | -0.0947 | 0.2112 | |
| GSE53624 | GLCE | 26035 | 49365 | -0.1375 | 0.0863 | |
| GSE63941 | GLCE | 26035 | 213552_at | -1.5838 | 0.0162 | |
| GSE77861 | GLCE | 26035 | 213552_at | -0.4569 | 0.3445 | |
| GSE97050 | GLCE | 26035 | A_23_P151870 | -0.2829 | 0.4797 | |
| SRP007169 | GLCE | 26035 | RNAseq | -2.2894 | 0.0000 | |
| SRP008496 | GLCE | 26035 | RNAseq | -1.3989 | 0.0001 | |
| SRP064894 | GLCE | 26035 | RNAseq | -1.0030 | 0.0000 | |
| SRP133303 | GLCE | 26035 | RNAseq | -0.4798 | 0.0230 | |
| SRP159526 | GLCE | 26035 | RNAseq | -0.5852 | 0.1716 | |
| SRP193095 | GLCE | 26035 | RNAseq | -0.9252 | 0.0000 | |
| SRP219564 | GLCE | 26035 | RNAseq | -0.5916 | 0.1235 | |
| TCGA | GLCE | 26035 | RNAseq | 0.0339 | 0.5866 |
Upregulated datasets: 0; Downregulated datasets: 5.
Survival by GLCE expression:
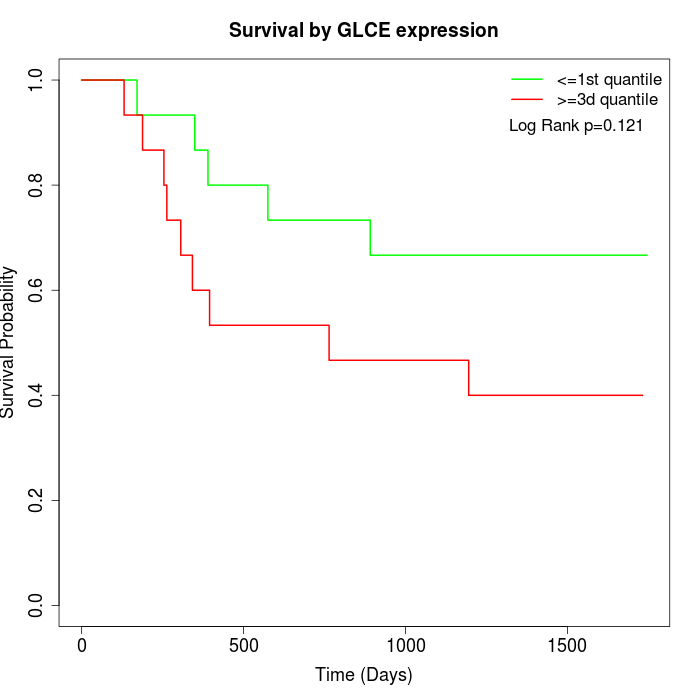 | 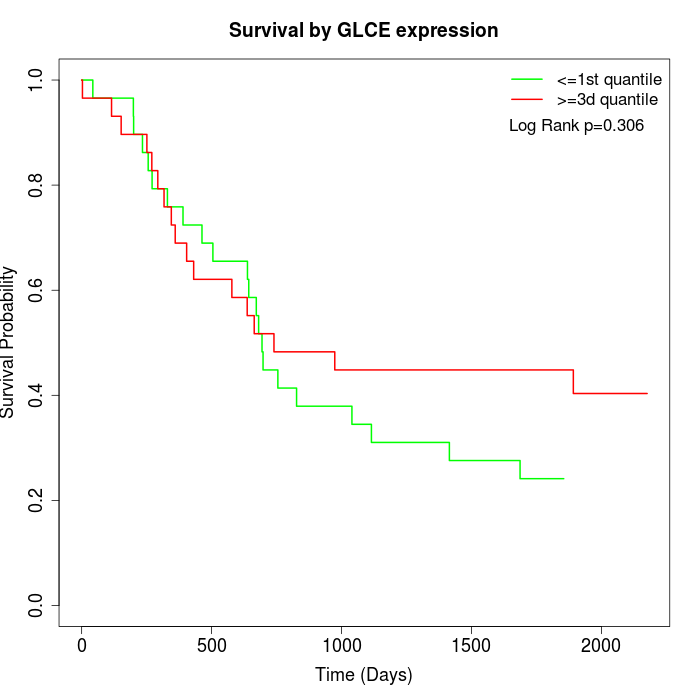 | 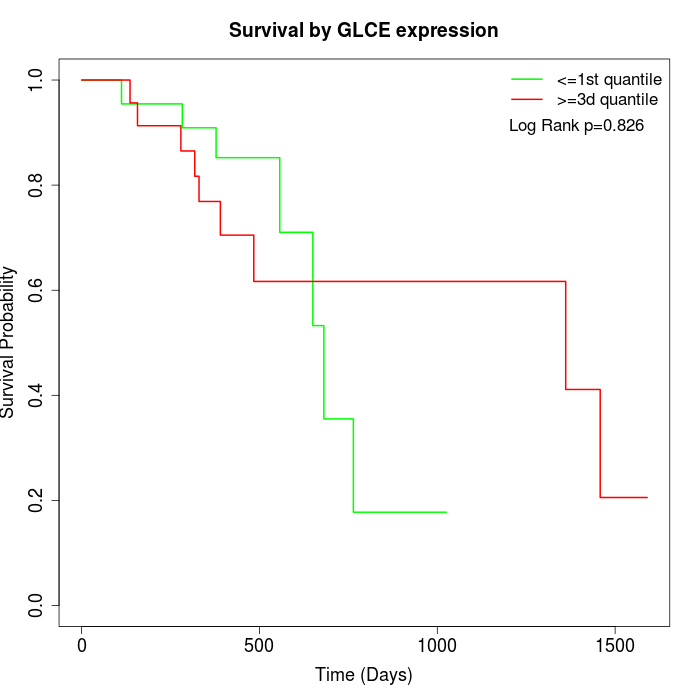 |
| GSE53622 | GSE53624 | TCGA |
Note: Click image to view full size file.
Copy number change of GLCE:
| Dataset | Gene | EntrezID | Gain | Loss | Normal | Detail |
|---|---|---|---|---|---|---|
| GSE15526 | GLCE | 26035 | 7 | 1 | 22 | |
| GSE20123 | GLCE | 26035 | 7 | 1 | 22 | |
| GSE43470 | GLCE | 26035 | 4 | 6 | 33 | |
| GSE46452 | GLCE | 26035 | 3 | 7 | 49 | |
| GSE47630 | GLCE | 26035 | 8 | 10 | 22 | |
| GSE54993 | GLCE | 26035 | 5 | 6 | 59 | |
| GSE54994 | GLCE | 26035 | 5 | 9 | 39 | |
| GSE60625 | GLCE | 26035 | 4 | 0 | 7 | |
| GSE74703 | GLCE | 26035 | 4 | 3 | 29 | |
| GSE74704 | GLCE | 26035 | 3 | 1 | 16 | |
| TCGA | GLCE | 26035 | 10 | 15 | 71 |
Total number of gains: 60; Total number of losses: 59; Total Number of normals: 369.
Somatic mutations of GLCE:
Generating mutation plots.
Highly correlated genes for GLCE:
Showing top 20/535 corelated genes with mean PCC>0.5.
| Gene1 | Gene2 | Mean PCC | Num. Datasets | Num. PCC<0 | Num. PCC>0.5 |
|---|---|---|---|---|---|
| GLCE | SPEG | 0.769003 | 3 | 0 | 3 |
| GLCE | LDHD | 0.767625 | 3 | 0 | 3 |
| GLCE | TBCK | 0.748327 | 3 | 0 | 3 |
| GLCE | DLG3 | 0.737893 | 4 | 0 | 4 |
| GLCE | FGFR1OP2 | 0.732867 | 3 | 0 | 3 |
| GLCE | ITGA2 | 0.728089 | 3 | 0 | 3 |
| GLCE | KRTAP12-2 | 0.717825 | 3 | 0 | 3 |
| GLCE | ALDH1A3 | 0.715251 | 5 | 0 | 5 |
| GLCE | CD109 | 0.714953 | 3 | 0 | 3 |
| GLCE | TMX3 | 0.712945 | 3 | 0 | 3 |
| GLCE | ALDOC | 0.712823 | 4 | 0 | 3 |
| GLCE | AP3M1 | 0.710918 | 4 | 0 | 3 |
| GLCE | RASSF9 | 0.705001 | 3 | 0 | 3 |
| GLCE | CELA3A | 0.703188 | 4 | 0 | 4 |
| GLCE | VAX2 | 0.699355 | 3 | 0 | 3 |
| GLCE | USP9Y | 0.698027 | 3 | 0 | 3 |
| GLCE | CALY | 0.692807 | 3 | 0 | 3 |
| GLCE | MAOB | 0.691548 | 4 | 0 | 4 |
| GLCE | ZFY | 0.686996 | 3 | 0 | 3 |
| GLCE | ATMIN | 0.684871 | 5 | 0 | 4 |
For details and further investigation, click here