| Full name: adaptor related protein complex 3 subunit mu 1 | Alias Symbol: | ||
| Type: protein-coding gene | Cytoband: 10q22.2 | ||
| Entrez ID: 26985 | HGNC ID: HGNC:569 | Ensembl Gene: ENSG00000185009 | OMIM ID: 610366 |
Screen Evidence:
| |||
Expression of AP3M1:
| Dataset | Gene | EntrezID | Probe | Log2FC | Adj.pValue | Expression |
|---|---|---|---|---|---|---|
| GSE17351 | AP3M1 | 26985 | 222516_at | -0.3590 | 0.4220 | |
| GSE26886 | AP3M1 | 26985 | 222516_at | -1.6889 | 0.0003 | |
| GSE45670 | AP3M1 | 26985 | 222516_at | -0.1847 | 0.1758 | |
| GSE53622 | AP3M1 | 26985 | 43829 | -0.1407 | 0.0179 | |
| GSE53624 | AP3M1 | 26985 | 43829 | 0.0357 | 0.5546 | |
| GSE63941 | AP3M1 | 26985 | 222516_at | 0.0491 | 0.9708 | |
| GSE77861 | AP3M1 | 26985 | 222516_at | -0.4128 | 0.0592 | |
| GSE97050 | AP3M1 | 26985 | A_23_P158938 | 0.0319 | 0.9010 | |
| SRP007169 | AP3M1 | 26985 | RNAseq | -0.8583 | 0.0390 | |
| SRP008496 | AP3M1 | 26985 | RNAseq | -0.5136 | 0.0250 | |
| SRP064894 | AP3M1 | 26985 | RNAseq | -0.5281 | 0.0001 | |
| SRP133303 | AP3M1 | 26985 | RNAseq | 0.0138 | 0.9052 | |
| SRP159526 | AP3M1 | 26985 | RNAseq | -0.2819 | 0.4564 | |
| SRP193095 | AP3M1 | 26985 | RNAseq | -0.4262 | 0.0000 | |
| SRP219564 | AP3M1 | 26985 | RNAseq | -0.3610 | 0.0737 | |
| TCGA | AP3M1 | 26985 | RNAseq | -0.1116 | 0.0116 |
Upregulated datasets: 0; Downregulated datasets: 1.
Survival by AP3M1 expression:
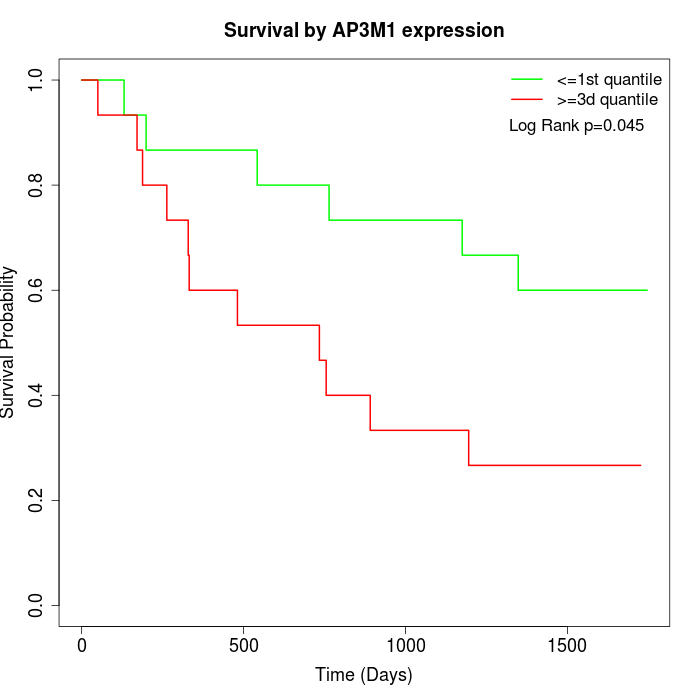 | 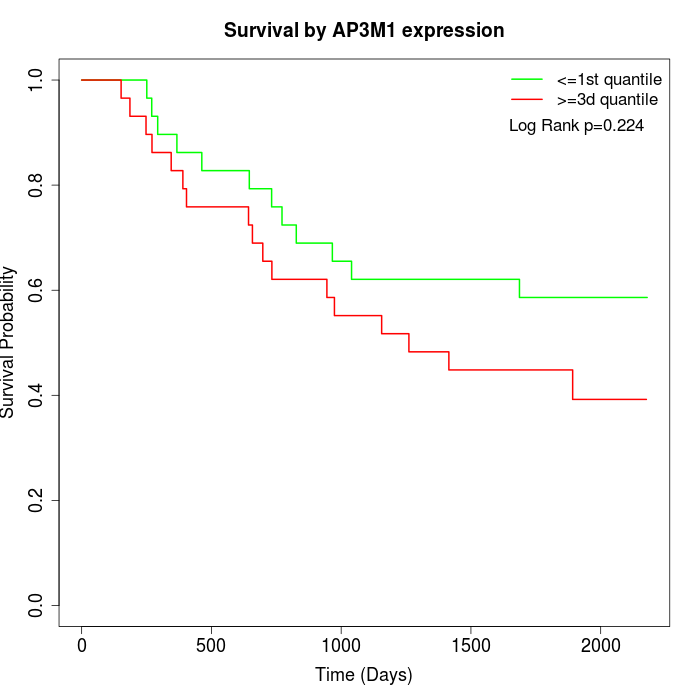 | 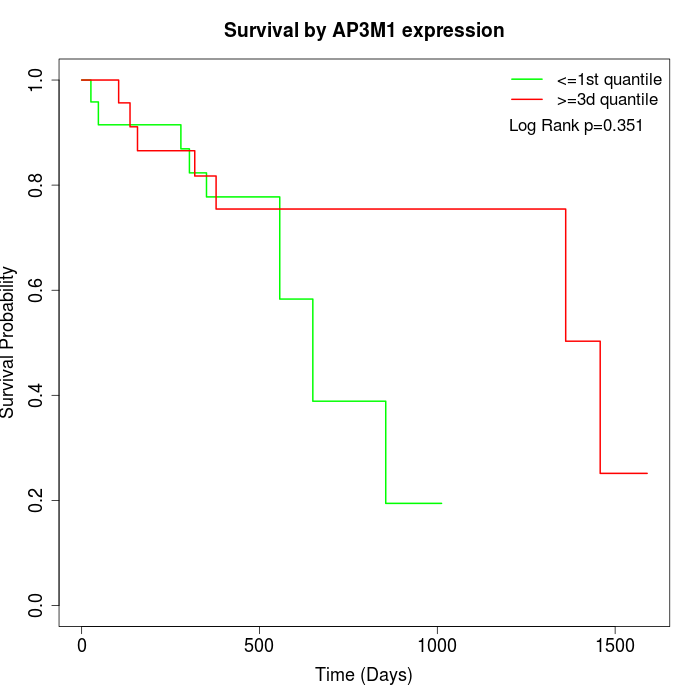 |
| GSE53622 | GSE53624 | TCGA |
Note: Click image to view full size file.
Copy number change of AP3M1:
| Dataset | Gene | EntrezID | Gain | Loss | Normal | Detail |
|---|---|---|---|---|---|---|
| GSE15526 | AP3M1 | 26985 | 3 | 4 | 23 | |
| GSE20123 | AP3M1 | 26985 | 3 | 3 | 24 | |
| GSE43470 | AP3M1 | 26985 | 1 | 8 | 34 | |
| GSE46452 | AP3M1 | 26985 | 0 | 11 | 48 | |
| GSE47630 | AP3M1 | 26985 | 2 | 14 | 24 | |
| GSE54993 | AP3M1 | 26985 | 7 | 0 | 63 | |
| GSE54994 | AP3M1 | 26985 | 2 | 10 | 41 | |
| GSE60625 | AP3M1 | 26985 | 0 | 0 | 11 | |
| GSE74703 | AP3M1 | 26985 | 1 | 5 | 30 | |
| GSE74704 | AP3M1 | 26985 | 1 | 1 | 18 | |
| TCGA | AP3M1 | 26985 | 10 | 23 | 63 |
Total number of gains: 30; Total number of losses: 79; Total Number of normals: 379.
Somatic mutations of AP3M1:
Generating mutation plots.
Highly correlated genes for AP3M1:
Showing top 20/579 corelated genes with mean PCC>0.5.
| Gene1 | Gene2 | Mean PCC | Num. Datasets | Num. PCC<0 | Num. PCC>0.5 |
|---|---|---|---|---|---|
| AP3M1 | TMEM218 | 0.852184 | 3 | 0 | 3 |
| AP3M1 | LMO4 | 0.842035 | 3 | 0 | 3 |
| AP3M1 | STOML2 | 0.815211 | 3 | 0 | 3 |
| AP3M1 | SETX | 0.804214 | 3 | 0 | 3 |
| AP3M1 | EMCN | 0.800625 | 3 | 0 | 3 |
| AP3M1 | FGFR1OP2 | 0.788221 | 3 | 0 | 3 |
| AP3M1 | PPID | 0.785196 | 3 | 0 | 3 |
| AP3M1 | UQCRFS1 | 0.777778 | 3 | 0 | 3 |
| AP3M1 | NBN | 0.775377 | 3 | 0 | 3 |
| AP3M1 | CUL2 | 0.769714 | 3 | 0 | 3 |
| AP3M1 | ABHD14B | 0.768622 | 4 | 0 | 4 |
| AP3M1 | UBE4B | 0.762272 | 4 | 0 | 4 |
| AP3M1 | CDKN1B | 0.761588 | 3 | 0 | 3 |
| AP3M1 | RHBDD1 | 0.760581 | 3 | 0 | 3 |
| AP3M1 | SLC25A3 | 0.75995 | 3 | 0 | 3 |
| AP3M1 | RNF207 | 0.75693 | 3 | 0 | 3 |
| AP3M1 | DUSP16 | 0.751597 | 3 | 0 | 3 |
| AP3M1 | RBL2 | 0.750734 | 3 | 0 | 3 |
| AP3M1 | ACADM | 0.749756 | 3 | 0 | 3 |
| AP3M1 | GPSM2 | 0.74954 | 3 | 0 | 3 |
For details and further investigation, click here