| Full name: TBC1 domain family member 19 | Alias Symbol: FLJ11082 | ||
| Type: protein-coding gene | Cytoband: 4p15.2 | ||
| Entrez ID: 55296 | HGNC ID: HGNC:25624 | Ensembl Gene: ENSG00000109680 | OMIM ID: |
Expression of TBC1D19:
| Dataset | Gene | EntrezID | Probe | Log2FC | Adj.pValue | Expression |
|---|---|---|---|---|---|---|
| GSE17351 | TBC1D19 | 55296 | 220260_at | 0.0316 | 0.9645 | |
| GSE20347 | TBC1D19 | 55296 | 220260_at | 0.1742 | 0.1666 | |
| GSE23400 | TBC1D19 | 55296 | 220260_at | -0.0251 | 0.5967 | |
| GSE26886 | TBC1D19 | 55296 | 220260_at | 0.1545 | 0.3621 | |
| GSE29001 | TBC1D19 | 55296 | 220260_at | 0.0581 | 0.8666 | |
| GSE38129 | TBC1D19 | 55296 | 220260_at | 0.2210 | 0.0345 | |
| GSE45670 | TBC1D19 | 55296 | 220260_at | 0.0592 | 0.7139 | |
| GSE53622 | TBC1D19 | 55296 | 41058 | 0.1320 | 0.2334 | |
| GSE53624 | TBC1D19 | 55296 | 41058 | 0.3435 | 0.0000 | |
| GSE63941 | TBC1D19 | 55296 | 220260_at | -3.1145 | 0.0003 | |
| GSE77861 | TBC1D19 | 55296 | 220260_at | -0.1513 | 0.1473 | |
| GSE97050 | TBC1D19 | 55296 | A_23_P136196 | -0.0871 | 0.6706 | |
| SRP007169 | TBC1D19 | 55296 | RNAseq | 0.0790 | 0.8793 | |
| SRP064894 | TBC1D19 | 55296 | RNAseq | 0.6431 | 0.0030 | |
| SRP133303 | TBC1D19 | 55296 | RNAseq | 0.1628 | 0.4190 | |
| SRP159526 | TBC1D19 | 55296 | RNAseq | 0.7173 | 0.0097 | |
| SRP193095 | TBC1D19 | 55296 | RNAseq | 0.1637 | 0.1817 | |
| SRP219564 | TBC1D19 | 55296 | RNAseq | 0.2221 | 0.5635 | |
| TCGA | TBC1D19 | 55296 | RNAseq | -0.1362 | 0.1567 |
Upregulated datasets: 0; Downregulated datasets: 1.
Survival by TBC1D19 expression:
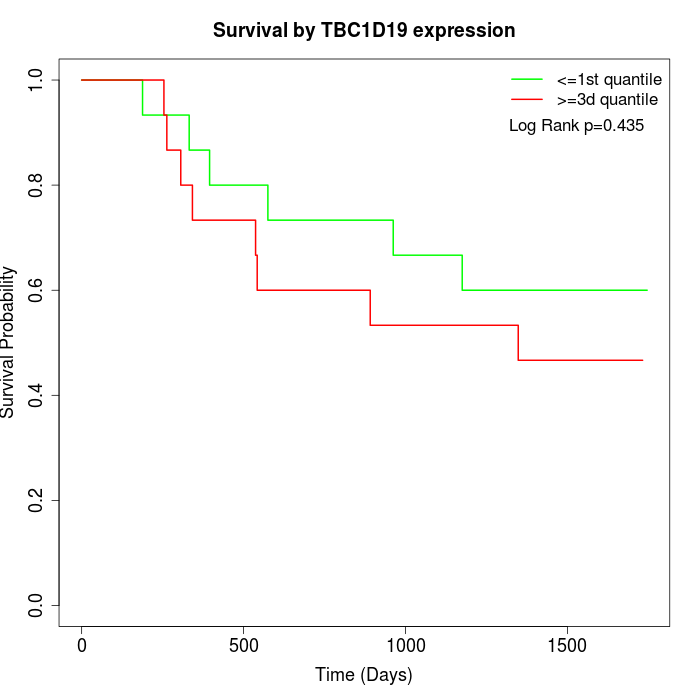 | 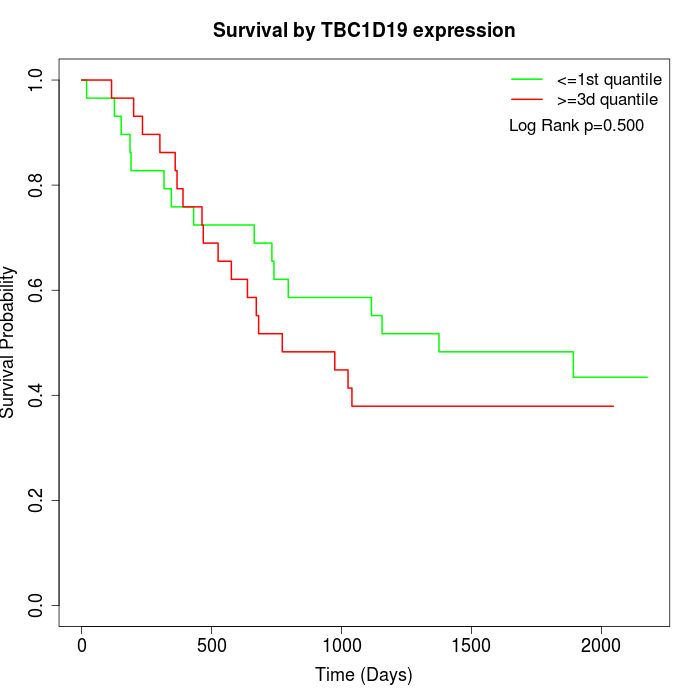 | 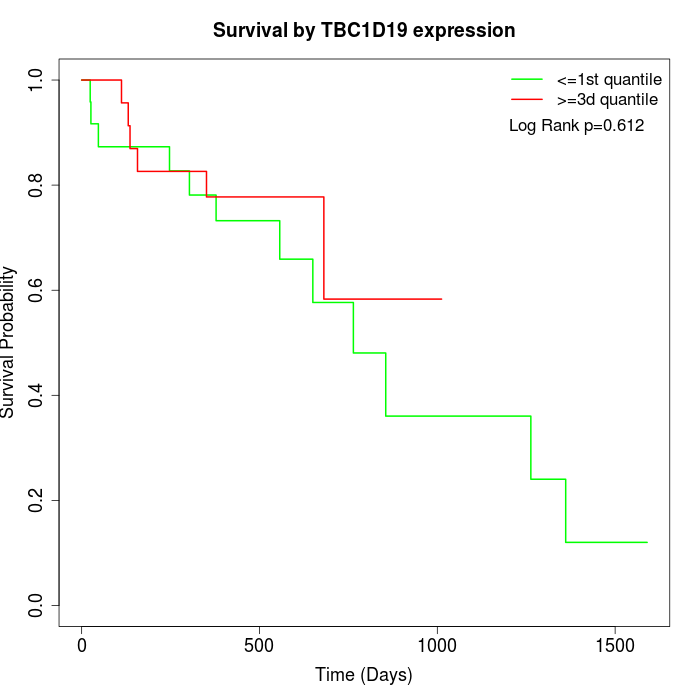 |
| GSE53622 | GSE53624 | TCGA |
Note: Click image to view full size file.
Copy number change of TBC1D19:
| Dataset | Gene | EntrezID | Gain | Loss | Normal | Detail |
|---|---|---|---|---|---|---|
| GSE15526 | TBC1D19 | 55296 | 0 | 18 | 12 | |
| GSE20123 | TBC1D19 | 55296 | 0 | 16 | 14 | |
| GSE43470 | TBC1D19 | 55296 | 0 | 14 | 29 | |
| GSE46452 | TBC1D19 | 55296 | 1 | 36 | 22 | |
| GSE47630 | TBC1D19 | 55296 | 1 | 19 | 20 | |
| GSE54993 | TBC1D19 | 55296 | 9 | 0 | 61 | |
| GSE54994 | TBC1D19 | 55296 | 5 | 11 | 37 | |
| GSE60625 | TBC1D19 | 55296 | 0 | 0 | 11 | |
| GSE74703 | TBC1D19 | 55296 | 0 | 12 | 24 | |
| GSE74704 | TBC1D19 | 55296 | 0 | 10 | 10 | |
| TCGA | TBC1D19 | 55296 | 11 | 47 | 38 |
Total number of gains: 27; Total number of losses: 183; Total Number of normals: 278.
Somatic mutations of TBC1D19:
Generating mutation plots.
Highly correlated genes for TBC1D19:
Showing top 20/313 corelated genes with mean PCC>0.5.
| Gene1 | Gene2 | Mean PCC | Num. Datasets | Num. PCC<0 | Num. PCC>0.5 |
|---|---|---|---|---|---|
| TBC1D19 | ATL1 | 0.802466 | 3 | 0 | 3 |
| TBC1D19 | FAM98B | 0.778703 | 3 | 0 | 3 |
| TBC1D19 | MTMR9 | 0.770706 | 3 | 0 | 3 |
| TBC1D19 | HGF | 0.766379 | 3 | 0 | 3 |
| TBC1D19 | NKIRAS1 | 0.760262 | 3 | 0 | 3 |
| TBC1D19 | SAR1A | 0.759822 | 3 | 0 | 3 |
| TBC1D19 | PAQR3 | 0.744579 | 3 | 0 | 3 |
| TBC1D19 | SNX18 | 0.739366 | 3 | 0 | 3 |
| TBC1D19 | PRICKLE2 | 0.736626 | 4 | 0 | 3 |
| TBC1D19 | UBE2Q2 | 0.73386 | 4 | 0 | 3 |
| TBC1D19 | GLIS3 | 0.730259 | 3 | 0 | 3 |
| TBC1D19 | IGFBP6 | 0.729557 | 3 | 0 | 3 |
| TBC1D19 | DIXDC1 | 0.728797 | 3 | 0 | 3 |
| TBC1D19 | PXK | 0.724811 | 3 | 0 | 3 |
| TBC1D19 | FAM155A | 0.720661 | 3 | 0 | 3 |
| TBC1D19 | ZNF578 | 0.713692 | 3 | 0 | 3 |
| TBC1D19 | SH3RF3 | 0.71256 | 3 | 0 | 3 |
| TBC1D19 | ZNF717 | 0.709035 | 3 | 0 | 3 |
| TBC1D19 | ALDH1L2 | 0.706742 | 3 | 0 | 3 |
| TBC1D19 | PLSCR4 | 0.703173 | 3 | 0 | 3 |
For details and further investigation, click here