| Full name: glycolipid transfer protein domain containing 2 | Alias Symbol: | ||
| Type: protein-coding gene | Cytoband: 17p13.2 | ||
| Entrez ID: 388323 | HGNC ID: HGNC:33756 | Ensembl Gene: ENSG00000182327 | OMIM ID: |
Expression of GLTPD2:
| Dataset | Gene | EntrezID | Probe | Log2FC | Adj.pValue | Expression |
|---|---|---|---|---|---|---|
| GSE17351 | GLTPD2 | 388323 | 230971_x_at | 0.1180 | 0.7156 | |
| GSE26886 | GLTPD2 | 388323 | 230971_x_at | 0.3792 | 0.0041 | |
| GSE45670 | GLTPD2 | 388323 | 230971_x_at | -0.0063 | 0.9628 | |
| GSE53622 | GLTPD2 | 388323 | 17579 | 0.2530 | 0.0003 | |
| GSE53624 | GLTPD2 | 388323 | 17579 | 0.1335 | 0.0300 | |
| GSE63941 | GLTPD2 | 388323 | 230971_x_at | -0.2323 | 0.2124 | |
| GSE77861 | GLTPD2 | 388323 | 230971_x_at | -0.1725 | 0.2981 | |
| GSE97050 | GLTPD2 | 388323 | A_24_P392925 | 0.1762 | 0.4280 | |
| SRP133303 | GLTPD2 | 388323 | RNAseq | -0.4049 | 0.2143 | |
| SRP159526 | GLTPD2 | 388323 | RNAseq | -0.5493 | 0.1638 | |
| SRP219564 | GLTPD2 | 388323 | RNAseq | -0.2927 | 0.6760 | |
| TCGA | GLTPD2 | 388323 | RNAseq | 0.4395 | 0.4085 |
Upregulated datasets: 0; Downregulated datasets: 0.
Survival by GLTPD2 expression:
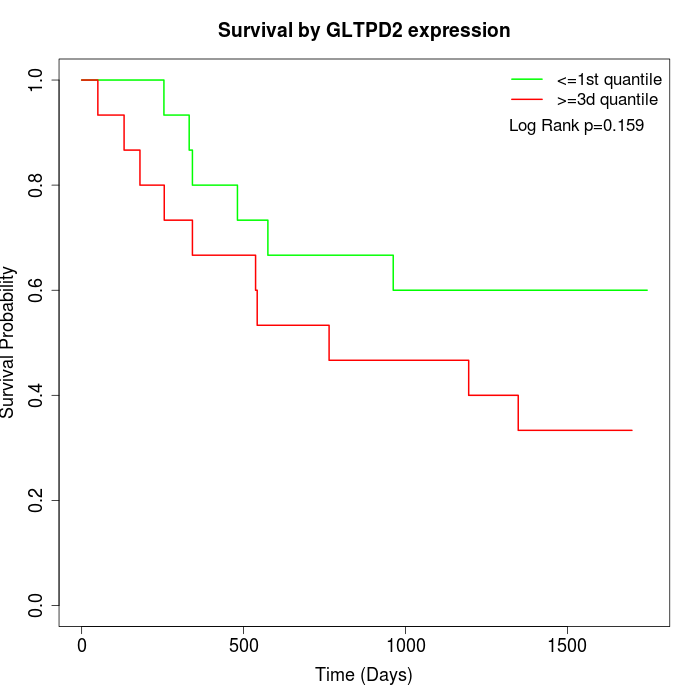 | 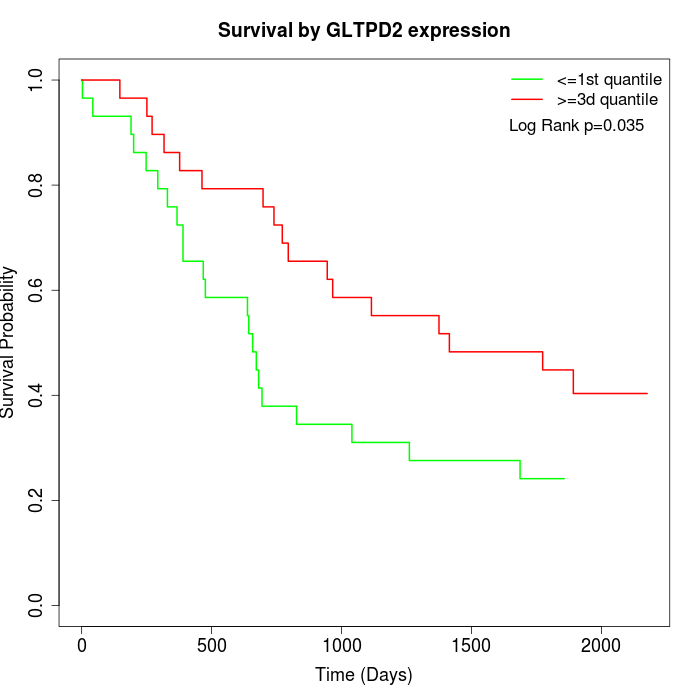 |  |
| GSE53622 | GSE53624 | TCGA |
Note: Click image to view full size file.
Copy number change of GLTPD2:
| Dataset | Gene | EntrezID | Gain | Loss | Normal | Detail |
|---|---|---|---|---|---|---|
| GSE15526 | GLTPD2 | 388323 | 5 | 2 | 23 | |
| GSE20123 | GLTPD2 | 388323 | 5 | 3 | 22 | |
| GSE43470 | GLTPD2 | 388323 | 1 | 6 | 36 | |
| GSE46452 | GLTPD2 | 388323 | 34 | 1 | 24 | |
| GSE47630 | GLTPD2 | 388323 | 7 | 1 | 32 | |
| GSE54993 | GLTPD2 | 388323 | 4 | 3 | 63 | |
| GSE54994 | GLTPD2 | 388323 | 5 | 9 | 39 | |
| GSE60625 | GLTPD2 | 388323 | 4 | 0 | 7 | |
| GSE74703 | GLTPD2 | 388323 | 1 | 3 | 32 | |
| GSE74704 | GLTPD2 | 388323 | 3 | 1 | 16 | |
| TCGA | GLTPD2 | 388323 | 19 | 21 | 56 |
Total number of gains: 88; Total number of losses: 50; Total Number of normals: 350.
Somatic mutations of GLTPD2:
Generating mutation plots.
Highly correlated genes for GLTPD2:
Showing top 20/219 corelated genes with mean PCC>0.5.
| Gene1 | Gene2 | Mean PCC | Num. Datasets | Num. PCC<0 | Num. PCC>0.5 |
|---|---|---|---|---|---|
| GLTPD2 | OPRD1 | 0.80732 | 3 | 0 | 3 |
| GLTPD2 | GJA3 | 0.803152 | 3 | 0 | 3 |
| GLTPD2 | IGFL2 | 0.750724 | 3 | 0 | 3 |
| GLTPD2 | BSND | 0.750438 | 3 | 0 | 3 |
| GLTPD2 | SLC35F3 | 0.715937 | 3 | 0 | 3 |
| GLTPD2 | PROC | 0.70573 | 4 | 0 | 3 |
| GLTPD2 | RAD52 | 0.700676 | 3 | 0 | 3 |
| GLTPD2 | FURIN | 0.70016 | 3 | 0 | 3 |
| GLTPD2 | PRMT5 | 0.697078 | 3 | 0 | 3 |
| GLTPD2 | FAM151A | 0.69418 | 3 | 0 | 3 |
| GLTPD2 | ABCC6 | 0.688525 | 4 | 0 | 4 |
| GLTPD2 | CHRD | 0.687332 | 3 | 0 | 3 |
| GLTPD2 | ANKRD53 | 0.687022 | 3 | 0 | 3 |
| GLTPD2 | LHB | 0.684307 | 3 | 0 | 3 |
| GLTPD2 | TTLL9 | 0.682767 | 4 | 0 | 3 |
| GLTPD2 | GPR39 | 0.67887 | 3 | 0 | 3 |
| GLTPD2 | COG4 | 0.677973 | 3 | 0 | 3 |
| GLTPD2 | CCNJL | 0.676312 | 3 | 0 | 3 |
| GLTPD2 | FAM171A2 | 0.67337 | 4 | 0 | 3 |
| GLTPD2 | ADAMTS7 | 0.670817 | 4 | 0 | 3 |
For details and further investigation, click here