| Full name: glycerol-3-phosphate acyltransferase, mitochondrial | Alias Symbol: KIAA1560|MGC26846|GPAT1 | ||
| Type: protein-coding gene | Cytoband: 10q25.2 | ||
| Entrez ID: 57678 | HGNC ID: HGNC:24865 | Ensembl Gene: ENSG00000119927 | OMIM ID: 602395 |
Expression of GPAM:
| Dataset | Gene | EntrezID | Probe | Log2FC | Adj.pValue | Expression |
|---|---|---|---|---|---|---|
| GSE17351 | GPAM | 57678 | 225424_at | 1.0023 | 0.2497 | |
| GSE26886 | GPAM | 57678 | 225424_at | 0.3792 | 0.4015 | |
| GSE45670 | GPAM | 57678 | 225420_at | 0.4492 | 0.0080 | |
| GSE53622 | GPAM | 57678 | 68508 | 0.1406 | 0.3433 | |
| GSE53624 | GPAM | 57678 | 68508 | 0.5335 | 0.0043 | |
| GSE63941 | GPAM | 57678 | 225424_at | -0.5745 | 0.2456 | |
| GSE77861 | GPAM | 57678 | 225424_at | 0.0577 | 0.8110 | |
| GSE97050 | GPAM | 57678 | A_33_P3340639 | 0.3284 | 0.2867 | |
| SRP007169 | GPAM | 57678 | RNAseq | 0.7028 | 0.0977 | |
| SRP008496 | GPAM | 57678 | RNAseq | 0.5623 | 0.0398 | |
| SRP064894 | GPAM | 57678 | RNAseq | 0.2899 | 0.0605 | |
| SRP133303 | GPAM | 57678 | RNAseq | 0.5416 | 0.0007 | |
| SRP159526 | GPAM | 57678 | RNAseq | 0.2118 | 0.3765 | |
| SRP193095 | GPAM | 57678 | RNAseq | 0.0722 | 0.4637 | |
| SRP219564 | GPAM | 57678 | RNAseq | 0.0530 | 0.8946 | |
| TCGA | GPAM | 57678 | RNAseq | -0.2846 | 0.0000 |
Upregulated datasets: 0; Downregulated datasets: 0.
Survival by GPAM expression:
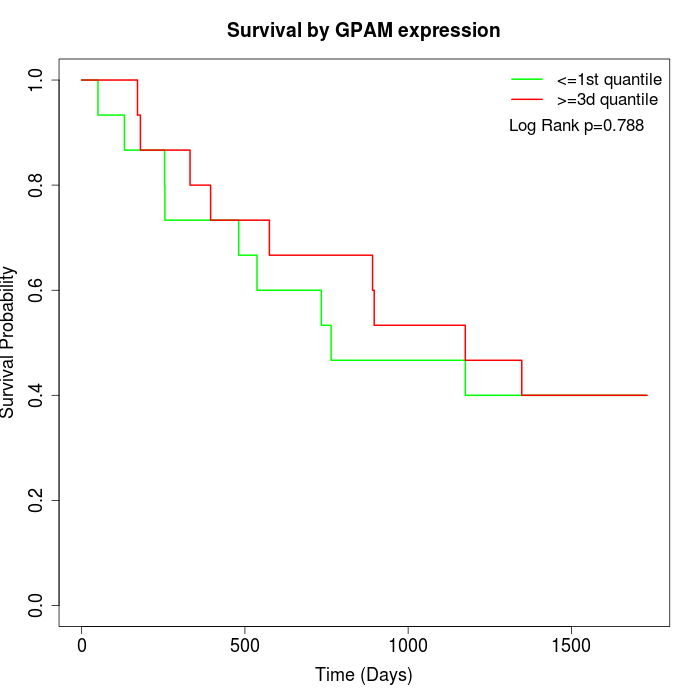 | 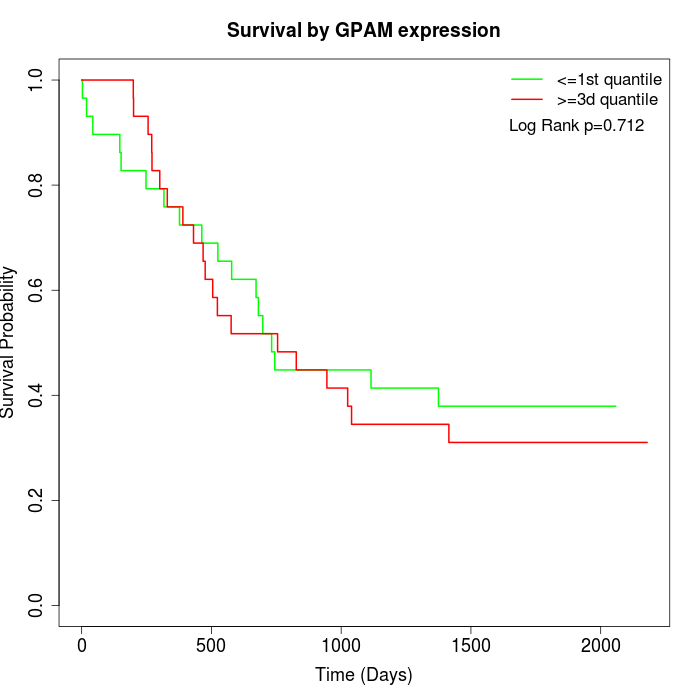 | 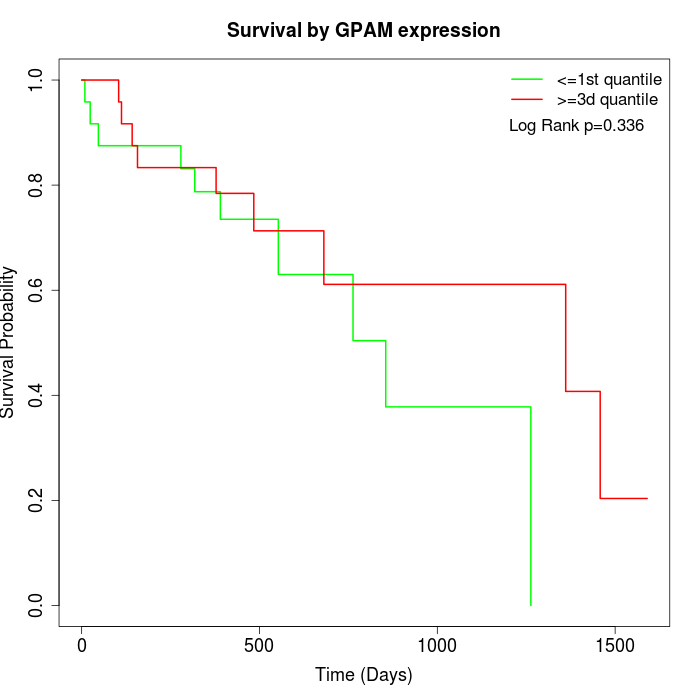 |
| GSE53622 | GSE53624 | TCGA |
Note: Click image to view full size file.
Copy number change of GPAM:
| Dataset | Gene | EntrezID | Gain | Loss | Normal | Detail |
|---|---|---|---|---|---|---|
| GSE15526 | GPAM | 57678 | 1 | 9 | 20 | |
| GSE20123 | GPAM | 57678 | 1 | 8 | 21 | |
| GSE43470 | GPAM | 57678 | 0 | 9 | 34 | |
| GSE46452 | GPAM | 57678 | 0 | 11 | 48 | |
| GSE47630 | GPAM | 57678 | 2 | 14 | 24 | |
| GSE54993 | GPAM | 57678 | 8 | 0 | 62 | |
| GSE54994 | GPAM | 57678 | 1 | 10 | 42 | |
| GSE60625 | GPAM | 57678 | 0 | 0 | 11 | |
| GSE74703 | GPAM | 57678 | 0 | 6 | 30 | |
| GSE74704 | GPAM | 57678 | 1 | 4 | 15 | |
| TCGA | GPAM | 57678 | 4 | 29 | 63 |
Total number of gains: 18; Total number of losses: 100; Total Number of normals: 370.
Somatic mutations of GPAM:
Generating mutation plots.
Highly correlated genes for GPAM:
Showing top 20/75 corelated genes with mean PCC>0.5.
| Gene1 | Gene2 | Mean PCC | Num. Datasets | Num. PCC<0 | Num. PCC>0.5 |
|---|---|---|---|---|---|
| GPAM | SF3A3 | 0.723207 | 3 | 0 | 3 |
| GPAM | PPIH | 0.703993 | 3 | 0 | 3 |
| GPAM | ZNF639 | 0.67503 | 3 | 0 | 3 |
| GPAM | POGLUT1 | 0.658249 | 3 | 0 | 3 |
| GPAM | MMACHC | 0.646714 | 3 | 0 | 3 |
| GPAM | VKORC1L1 | 0.643226 | 4 | 0 | 3 |
| GPAM | ASAH2B | 0.639489 | 4 | 0 | 3 |
| GPAM | WRAP73 | 0.63254 | 4 | 0 | 3 |
| GPAM | IRGQ | 0.632398 | 3 | 0 | 3 |
| GPAM | WRNIP1 | 0.623423 | 5 | 0 | 4 |
| GPAM | PIKFYVE | 0.617085 | 3 | 0 | 3 |
| GPAM | ZFP69B | 0.614089 | 5 | 0 | 4 |
| GPAM | YEATS4 | 0.610543 | 5 | 0 | 3 |
| GPAM | TBCCD1 | 0.608615 | 4 | 0 | 3 |
| GPAM | CD276 | 0.608452 | 3 | 0 | 3 |
| GPAM | ARL6IP1 | 0.603036 | 4 | 0 | 3 |
| GPAM | GEMIN2 | 0.598676 | 5 | 0 | 3 |
| GPAM | TMEM9 | 0.596325 | 3 | 0 | 3 |
| GPAM | GPR180 | 0.596319 | 5 | 0 | 4 |
| GPAM | RPAP3 | 0.595964 | 5 | 0 | 4 |
For details and further investigation, click here