| Full name: glycerol-3-phosphate acyltransferase 2, mitochondrial | Alias Symbol: CT123 | ||
| Type: protein-coding gene | Cytoband: 2q11.2 | ||
| Entrez ID: 150763 | HGNC ID: HGNC:27168 | Ensembl Gene: ENSG00000186281 | OMIM ID: 616431 |
Expression of GPAT2:
| Dataset | Gene | EntrezID | Probe | Log2FC | Adj.pValue | Expression |
|---|---|---|---|---|---|---|
| GSE17351 | GPAT2 | 150763 | 235557_at | 0.1422 | 0.9394 | |
| GSE26886 | GPAT2 | 150763 | 235557_at | 0.2276 | 0.5536 | |
| GSE45670 | GPAT2 | 150763 | 235557_at | -0.3864 | 0.1725 | |
| GSE53622 | GPAT2 | 150763 | 1751 | 0.1770 | 0.1285 | |
| GSE53624 | GPAT2 | 150763 | 1751 | 0.2129 | 0.0194 | |
| GSE63941 | GPAT2 | 150763 | 235557_at | -1.2358 | 0.0086 | |
| GSE77861 | GPAT2 | 150763 | 235557_at | -0.3038 | 0.0118 | |
| GSE97050 | GPAT2 | 150763 | A_33_P3210671 | -0.4008 | 0.1894 | |
| SRP064894 | GPAT2 | 150763 | RNAseq | 0.5365 | 0.1869 | |
| SRP133303 | GPAT2 | 150763 | RNAseq | -0.0080 | 0.9786 | |
| SRP193095 | GPAT2 | 150763 | RNAseq | 0.1275 | 0.7228 | |
| SRP219564 | GPAT2 | 150763 | RNAseq | 0.4283 | 0.4212 | |
| TCGA | GPAT2 | 150763 | RNAseq | -0.6811 | 0.0871 |
Upregulated datasets: 0; Downregulated datasets: 1.
Survival by GPAT2 expression:
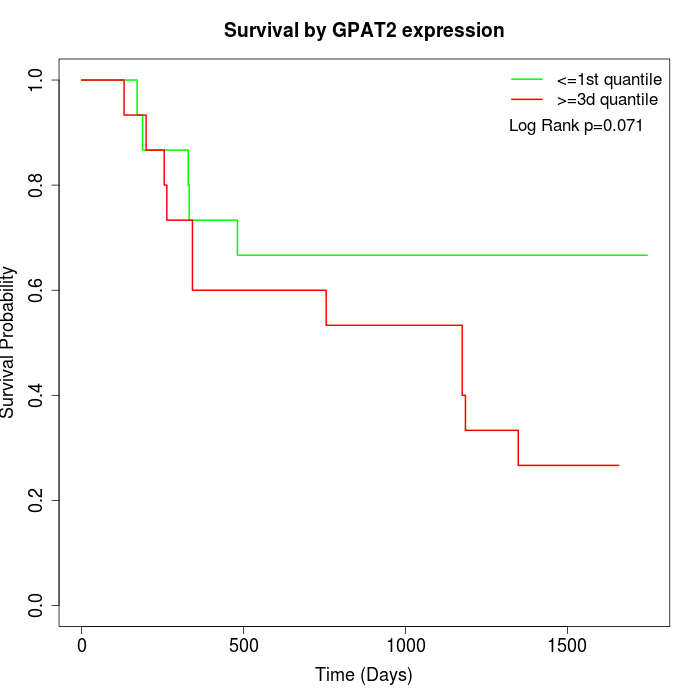 | 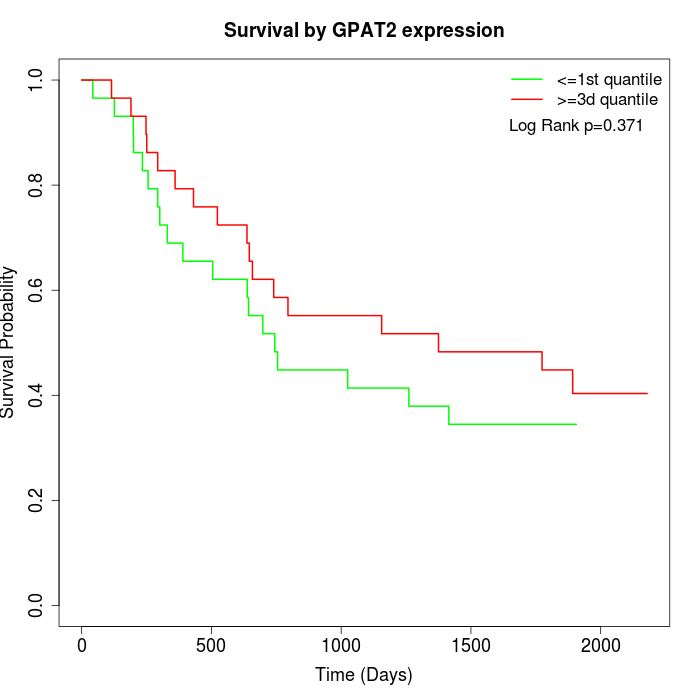 |  |
| GSE53622 | GSE53624 | TCGA |
Note: Click image to view full size file.
Copy number change of GPAT2:
| Dataset | Gene | EntrezID | Gain | Loss | Normal | Detail |
|---|---|---|---|---|---|---|
| GSE15526 | GPAT2 | 150763 | 6 | 2 | 22 | |
| GSE20123 | GPAT2 | 150763 | 6 | 2 | 22 | |
| GSE43470 | GPAT2 | 150763 | 2 | 3 | 38 | |
| GSE46452 | GPAT2 | 150763 | 2 | 3 | 54 | |
| GSE47630 | GPAT2 | 150763 | 7 | 0 | 33 | |
| GSE54993 | GPAT2 | 150763 | 0 | 6 | 64 | |
| GSE54994 | GPAT2 | 150763 | 11 | 0 | 42 | |
| GSE60625 | GPAT2 | 150763 | 0 | 3 | 8 | |
| GSE74703 | GPAT2 | 150763 | 2 | 2 | 32 | |
| GSE74704 | GPAT2 | 150763 | 4 | 1 | 15 | |
| TCGA | GPAT2 | 150763 | 35 | 3 | 58 |
Total number of gains: 75; Total number of losses: 25; Total Number of normals: 388.
Somatic mutations of GPAT2:
Generating mutation plots.
Highly correlated genes for GPAT2:
Showing top 20/190 corelated genes with mean PCC>0.5.
| Gene1 | Gene2 | Mean PCC | Num. Datasets | Num. PCC<0 | Num. PCC>0.5 |
|---|---|---|---|---|---|
| GPAT2 | TKTL1 | 0.882187 | 3 | 0 | 3 |
| GPAT2 | VILL | 0.806161 | 3 | 0 | 3 |
| GPAT2 | TMEM120B | 0.766445 | 3 | 0 | 3 |
| GPAT2 | DCDC1 | 0.748613 | 3 | 0 | 3 |
| GPAT2 | PAX6 | 0.741324 | 3 | 0 | 3 |
| GPAT2 | OR2T27 | 0.740065 | 3 | 0 | 3 |
| GPAT2 | FFAR1 | 0.738773 | 3 | 0 | 3 |
| GPAT2 | BSND | 0.738032 | 3 | 0 | 3 |
| GPAT2 | OR2A5 | 0.736766 | 3 | 0 | 3 |
| GPAT2 | AQP4 | 0.732969 | 3 | 0 | 3 |
| GPAT2 | FAM71F1 | 0.730778 | 3 | 0 | 3 |
| GPAT2 | TRIM10 | 0.72909 | 3 | 0 | 3 |
| GPAT2 | BTNL2 | 0.728563 | 4 | 0 | 4 |
| GPAT2 | ATCAY | 0.719065 | 3 | 0 | 3 |
| GPAT2 | YY2 | 0.718169 | 3 | 0 | 3 |
| GPAT2 | PRAMEF5 | 0.717121 | 3 | 0 | 3 |
| GPAT2 | OR2T1 | 0.715934 | 3 | 0 | 3 |
| GPAT2 | KRTAP10-12 | 0.715811 | 3 | 0 | 3 |
| GPAT2 | FAM228A | 0.714543 | 3 | 0 | 3 |
| GPAT2 | MYOZ3 | 0.712724 | 3 | 0 | 3 |
For details and further investigation, click here