| Full name: glutamate ionotropic receptor delta type subunit 1 | Alias Symbol: GluD1|KIAA1220 | ||
| Type: protein-coding gene | Cytoband: 10q23.1-q23.2 | ||
| Entrez ID: 2894 | HGNC ID: HGNC:4575 | Ensembl Gene: ENSG00000182771 | OMIM ID: 610659 |
Expression of GRID1:
| Dataset | Gene | EntrezID | Probe | Log2FC | Adj.pValue | Expression |
|---|---|---|---|---|---|---|
| GSE17351 | GRID1 | 2894 | 1555267_at | -0.0336 | 0.9455 | |
| GSE26886 | GRID1 | 2894 | 1555267_at | -0.0622 | 0.6566 | |
| GSE45670 | GRID1 | 2894 | 1555267_at | 0.1750 | 0.0790 | |
| GSE53622 | GRID1 | 2894 | 141937 | -0.1375 | 0.3757 | |
| GSE53624 | GRID1 | 2894 | 141937 | -0.2475 | 0.0887 | |
| GSE63941 | GRID1 | 2894 | 1555267_at | 0.1325 | 0.5182 | |
| GSE77861 | GRID1 | 2894 | 1555268_a_at | -0.0713 | 0.2231 | |
| GSE97050 | GRID1 | 2894 | A_33_P3234949 | 0.2471 | 0.2927 | |
| SRP064894 | GRID1 | 2894 | RNAseq | -0.4841 | 0.1735 | |
| SRP133303 | GRID1 | 2894 | RNAseq | -0.5950 | 0.0231 | |
| SRP159526 | GRID1 | 2894 | RNAseq | -0.2163 | 0.7483 | |
| SRP193095 | GRID1 | 2894 | RNAseq | 0.5425 | 0.0107 | |
| SRP219564 | GRID1 | 2894 | RNAseq | 0.1264 | 0.7367 | |
| TCGA | GRID1 | 2894 | RNAseq | -0.0428 | 0.8892 |
Upregulated datasets: 0; Downregulated datasets: 0.
Survival by GRID1 expression:
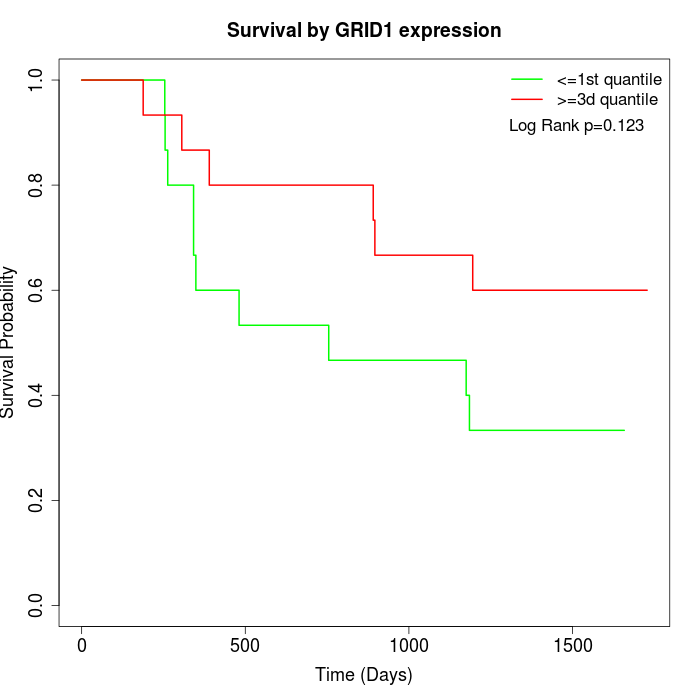 | 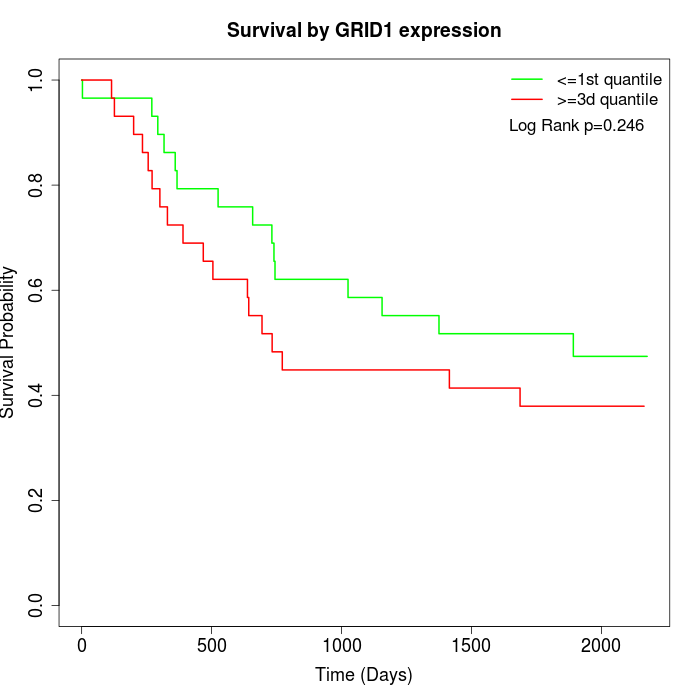 |  |
| GSE53622 | GSE53624 | TCGA |
Note: Click image to view full size file.
Copy number change of GRID1:
| Dataset | Gene | EntrezID | Gain | Loss | Normal | Detail |
|---|---|---|---|---|---|---|
| GSE15526 | GRID1 | 2894 | 1 | 7 | 22 | |
| GSE20123 | GRID1 | 2894 | 1 | 6 | 23 | |
| GSE43470 | GRID1 | 2894 | 1 | 6 | 36 | |
| GSE46452 | GRID1 | 2894 | 0 | 11 | 48 | |
| GSE47630 | GRID1 | 2894 | 2 | 14 | 24 | |
| GSE54993 | GRID1 | 2894 | 7 | 0 | 63 | |
| GSE54994 | GRID1 | 2894 | 1 | 12 | 40 | |
| GSE60625 | GRID1 | 2894 | 0 | 0 | 11 | |
| GSE74703 | GRID1 | 2894 | 1 | 4 | 31 | |
| GSE74704 | GRID1 | 2894 | 0 | 4 | 16 | |
| TCGA | GRID1 | 2894 | 8 | 27 | 61 |
Total number of gains: 22; Total number of losses: 91; Total Number of normals: 375.
Somatic mutations of GRID1:
Generating mutation plots.
Highly correlated genes for GRID1:
Showing top 20/44 corelated genes with mean PCC>0.5.
| Gene1 | Gene2 | Mean PCC | Num. Datasets | Num. PCC<0 | Num. PCC>0.5 |
|---|---|---|---|---|---|
| GRID1 | GP9 | 0.725843 | 4 | 0 | 3 |
| GRID1 | MYO1A | 0.716976 | 4 | 0 | 4 |
| GRID1 | PRRG1 | 0.712746 | 3 | 0 | 3 |
| GRID1 | GUCY2C | 0.710301 | 3 | 0 | 3 |
| GRID1 | HDGFL1 | 0.678453 | 4 | 0 | 3 |
| GRID1 | SEMA5B | 0.670104 | 3 | 0 | 3 |
| GRID1 | SIX3 | 0.665472 | 4 | 0 | 3 |
| GRID1 | ALDH1L1 | 0.660614 | 3 | 0 | 3 |
| GRID1 | GRIN1 | 0.660542 | 4 | 0 | 3 |
| GRID1 | ADRA1A | 0.660245 | 4 | 0 | 3 |
| GRID1 | AMHR2 | 0.657844 | 4 | 0 | 3 |
| GRID1 | MATN1 | 0.655536 | 3 | 0 | 3 |
| GRID1 | C10orf90 | 0.646152 | 4 | 0 | 3 |
| GRID1 | RASSF7 | 0.645256 | 4 | 0 | 3 |
| GRID1 | HRH2 | 0.636036 | 3 | 0 | 3 |
| GRID1 | NOX1 | 0.618634 | 4 | 0 | 3 |
| GRID1 | DNAAF1 | 0.611946 | 3 | 0 | 3 |
| GRID1 | ESAM | 0.608944 | 3 | 0 | 3 |
| GRID1 | TRPV3 | 0.603092 | 4 | 0 | 3 |
| GRID1 | CC2D2B | 0.597501 | 3 | 0 | 3 |
For details and further investigation, click here