| Full name: general transcription factor IIA subunit 1 | Alias Symbol: TFIIA | ||
| Type: protein-coding gene | Cytoband: 14q31.1 | ||
| Entrez ID: 2957 | HGNC ID: HGNC:4646 | Ensembl Gene: ENSG00000165417 | OMIM ID: 600520 |
Screen Evidence:
| |||
Expression of GTF2A1:
| Dataset | Gene | EntrezID | Probe | Log2FC | Adj.pValue | Expression |
|---|---|---|---|---|---|---|
| GSE17351 | GTF2A1 | 2957 | 225433_at | 0.0205 | 0.9732 | |
| GSE20347 | GTF2A1 | 2957 | 206521_s_at | -0.1415 | 0.0957 | |
| GSE23400 | GTF2A1 | 2957 | 206521_s_at | -0.0593 | 0.0188 | |
| GSE26886 | GTF2A1 | 2957 | 225433_at | -1.1160 | 0.0000 | |
| GSE29001 | GTF2A1 | 2957 | 206521_s_at | -0.0466 | 0.7640 | |
| GSE38129 | GTF2A1 | 2957 | 206521_s_at | -0.0508 | 0.5176 | |
| GSE45670 | GTF2A1 | 2957 | 225433_at | 0.0381 | 0.8026 | |
| GSE53622 | GTF2A1 | 2957 | 10414 | -0.1216 | 0.0324 | |
| GSE53624 | GTF2A1 | 2957 | 10414 | -0.0186 | 0.7731 | |
| GSE63941 | GTF2A1 | 2957 | 225433_at | -0.8018 | 0.0641 | |
| GSE77861 | GTF2A1 | 2957 | 225433_at | 0.0014 | 0.9977 | |
| GSE97050 | GTF2A1 | 2957 | A_23_P65609 | 0.3594 | 0.3793 | |
| SRP007169 | GTF2A1 | 2957 | RNAseq | -0.5412 | 0.0593 | |
| SRP008496 | GTF2A1 | 2957 | RNAseq | -0.1920 | 0.3389 | |
| SRP064894 | GTF2A1 | 2957 | RNAseq | -0.0813 | 0.7312 | |
| SRP133303 | GTF2A1 | 2957 | RNAseq | 0.4583 | 0.0009 | |
| SRP159526 | GTF2A1 | 2957 | RNAseq | -0.0321 | 0.9213 | |
| SRP193095 | GTF2A1 | 2957 | RNAseq | -0.1604 | 0.1121 | |
| SRP219564 | GTF2A1 | 2957 | RNAseq | -0.1043 | 0.8022 | |
| TCGA | GTF2A1 | 2957 | RNAseq | 0.0005 | 0.9951 |
Upregulated datasets: 0; Downregulated datasets: 1.
Survival by GTF2A1 expression:
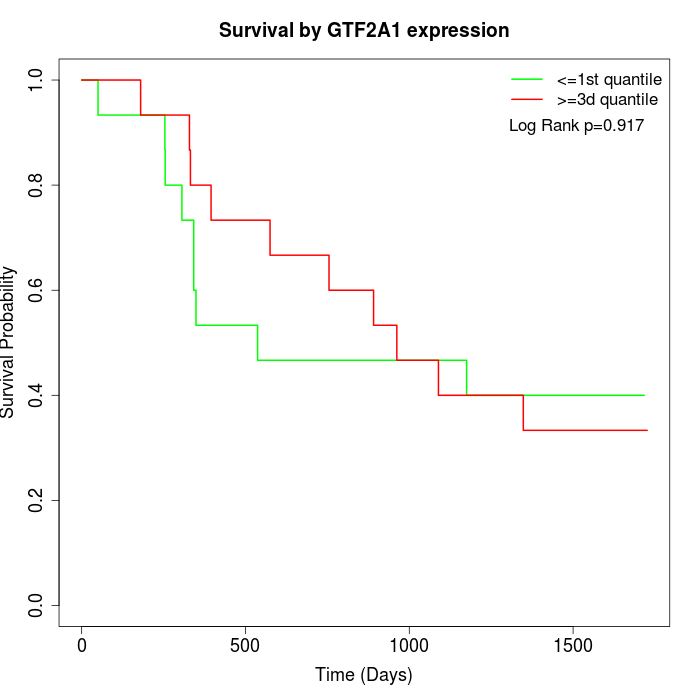 | 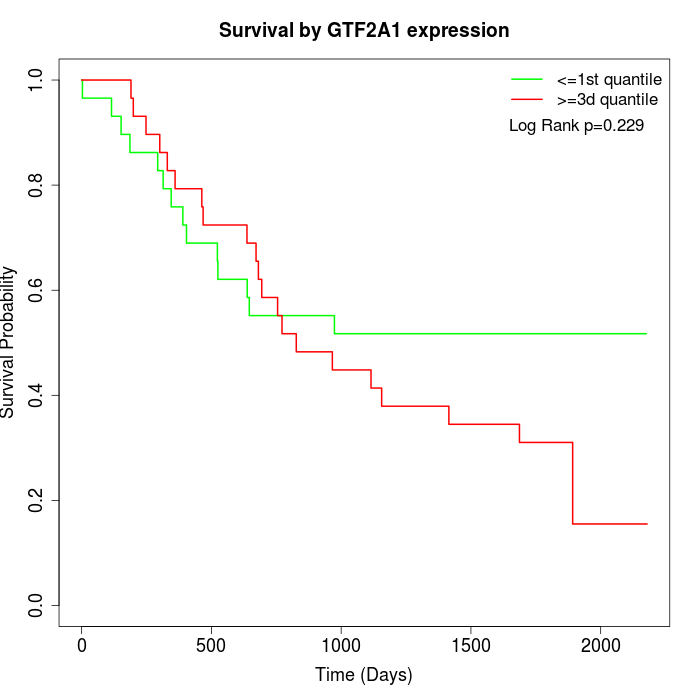 | 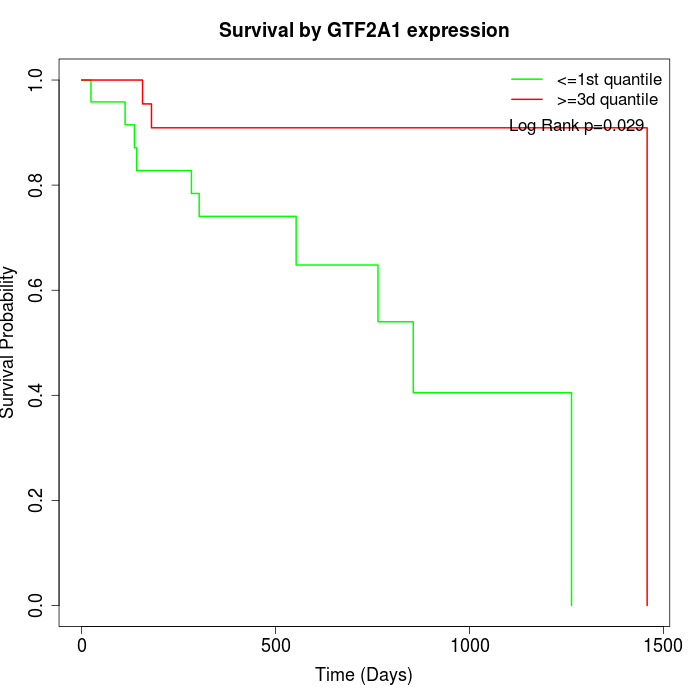 |
| GSE53622 | GSE53624 | TCGA |
Note: Click image to view full size file.
Copy number change of GTF2A1:
| Dataset | Gene | EntrezID | Gain | Loss | Normal | Detail |
|---|---|---|---|---|---|---|
| GSE15526 | GTF2A1 | 2957 | 9 | 3 | 18 | |
| GSE20123 | GTF2A1 | 2957 | 9 | 3 | 18 | |
| GSE43470 | GTF2A1 | 2957 | 8 | 3 | 32 | |
| GSE46452 | GTF2A1 | 2957 | 16 | 3 | 40 | |
| GSE47630 | GTF2A1 | 2957 | 11 | 8 | 21 | |
| GSE54993 | GTF2A1 | 2957 | 3 | 8 | 59 | |
| GSE54994 | GTF2A1 | 2957 | 19 | 4 | 30 | |
| GSE60625 | GTF2A1 | 2957 | 0 | 2 | 9 | |
| GSE74703 | GTF2A1 | 2957 | 7 | 3 | 26 | |
| GSE74704 | GTF2A1 | 2957 | 4 | 3 | 13 | |
| TCGA | GTF2A1 | 2957 | 31 | 19 | 46 |
Total number of gains: 117; Total number of losses: 59; Total Number of normals: 312.
Somatic mutations of GTF2A1:
Generating mutation plots.
Highly correlated genes for GTF2A1:
Showing top 20/396 corelated genes with mean PCC>0.5.
| Gene1 | Gene2 | Mean PCC | Num. Datasets | Num. PCC<0 | Num. PCC>0.5 |
|---|---|---|---|---|---|
| GTF2A1 | PDIK1L | 0.844884 | 3 | 0 | 3 |
| GTF2A1 | APH1A | 0.836555 | 3 | 0 | 3 |
| GTF2A1 | BROX | 0.802941 | 3 | 0 | 3 |
| GTF2A1 | YTHDF2 | 0.782059 | 3 | 0 | 3 |
| GTF2A1 | NAA25 | 0.780953 | 3 | 0 | 3 |
| GTF2A1 | MAGT1 | 0.77194 | 3 | 0 | 3 |
| GTF2A1 | HIBCH | 0.7567 | 3 | 0 | 3 |
| GTF2A1 | RASA2 | 0.755481 | 4 | 0 | 4 |
| GTF2A1 | TNKS2 | 0.747694 | 4 | 0 | 3 |
| GTF2A1 | SCOC | 0.746286 | 3 | 0 | 3 |
| GTF2A1 | QRICH1 | 0.740732 | 3 | 0 | 3 |
| GTF2A1 | ERCC6 | 0.740613 | 4 | 0 | 3 |
| GTF2A1 | DPY19L3 | 0.735884 | 3 | 0 | 3 |
| GTF2A1 | TMEM41B | 0.72582 | 3 | 0 | 3 |
| GTF2A1 | ZNF217 | 0.725396 | 3 | 0 | 3 |
| GTF2A1 | ZNF416 | 0.724959 | 4 | 0 | 3 |
| GTF2A1 | ARL6 | 0.721259 | 3 | 0 | 3 |
| GTF2A1 | KIF21A | 0.718957 | 3 | 0 | 3 |
| GTF2A1 | CCNYL1 | 0.718489 | 3 | 0 | 3 |
| GTF2A1 | SLC35A3 | 0.716204 | 3 | 0 | 3 |
For details and further investigation, click here