| Full name: HEXIM P-TEFb complex subunit 2 | Alias Symbol: FLJ32384 | ||
| Type: protein-coding gene | Cytoband: 17q21.31 | ||
| Entrez ID: 124790 | HGNC ID: HGNC:28591 | Ensembl Gene: ENSG00000168517 | OMIM ID: 615695 |
Expression of HEXIM2:
| Dataset | Gene | EntrezID | Probe | Log2FC | Adj.pValue | Expression |
|---|---|---|---|---|---|---|
| GSE17351 | HEXIM2 | 124790 | 238547_at | -0.3623 | 0.4233 | |
| GSE26886 | HEXIM2 | 124790 | 238547_at | 0.4964 | 0.0720 | |
| GSE45670 | HEXIM2 | 124790 | 238547_at | 0.1614 | 0.2758 | |
| GSE63941 | HEXIM2 | 124790 | 238547_at | 0.9745 | 0.1646 | |
| GSE77861 | HEXIM2 | 124790 | 238547_at | 0.0384 | 0.7928 | |
| GSE97050 | HEXIM2 | 124790 | A_23_P377214 | -0.0569 | 0.7959 | |
| SRP007169 | HEXIM2 | 124790 | RNAseq | 0.2431 | 0.6740 | |
| SRP064894 | HEXIM2 | 124790 | RNAseq | 0.4380 | 0.2418 | |
| SRP133303 | HEXIM2 | 124790 | RNAseq | -0.3563 | 0.1160 | |
| SRP159526 | HEXIM2 | 124790 | RNAseq | 0.5157 | 0.1428 | |
| SRP193095 | HEXIM2 | 124790 | RNAseq | -0.2644 | 0.0034 | |
| SRP219564 | HEXIM2 | 124790 | RNAseq | 0.1077 | 0.8182 | |
| TCGA | HEXIM2 | 124790 | RNAseq | -0.2728 | 0.0069 |
Upregulated datasets: 0; Downregulated datasets: 0.
Survival by HEXIM2 expression:
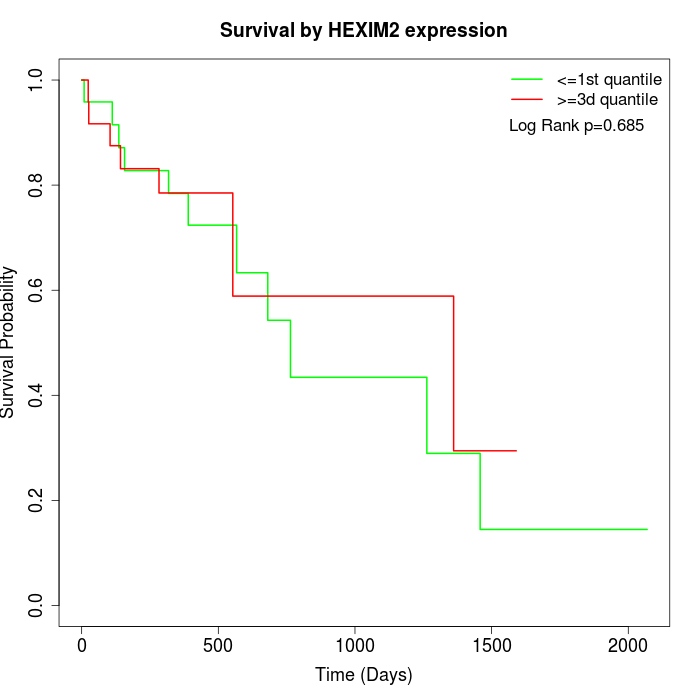 |
| TCGA |
Note: Click image to view full size file.
Copy number change of HEXIM2:
| Dataset | Gene | EntrezID | Gain | Loss | Normal | Detail |
|---|---|---|---|---|---|---|
| GSE15526 | HEXIM2 | 124790 | 6 | 2 | 22 | |
| GSE20123 | HEXIM2 | 124790 | 6 | 2 | 22 | |
| GSE43470 | HEXIM2 | 124790 | 3 | 2 | 38 | |
| GSE46452 | HEXIM2 | 124790 | 32 | 0 | 27 | |
| GSE47630 | HEXIM2 | 124790 | 9 | 0 | 31 | |
| GSE54993 | HEXIM2 | 124790 | 3 | 4 | 63 | |
| GSE54994 | HEXIM2 | 124790 | 9 | 5 | 39 | |
| GSE60625 | HEXIM2 | 124790 | 4 | 0 | 7 | |
| GSE74703 | HEXIM2 | 124790 | 2 | 1 | 33 | |
| GSE74704 | HEXIM2 | 124790 | 4 | 1 | 15 | |
| TCGA | HEXIM2 | 124790 | 26 | 7 | 63 |
Total number of gains: 104; Total number of losses: 24; Total Number of normals: 360.
Somatic mutations of HEXIM2:
Generating mutation plots.
Highly correlated genes for HEXIM2:
Showing all 19 correlated genes with mean PCC>0.5.
| Gene1 | Gene2 | Mean PCC | Num. Datasets | Num. PCC<0 | Num. PCC>0.5 |
|---|---|---|---|---|---|
| HEXIM2 | CDIPT | 0.670155 | 3 | 0 | 3 |
| HEXIM2 | NDUFB10 | 0.666932 | 4 | 0 | 4 |
| HEXIM2 | TOLLIP-AS1 | 0.666683 | 3 | 0 | 3 |
| HEXIM2 | SNAPC5 | 0.643118 | 3 | 0 | 3 |
| HEXIM2 | ZNF688 | 0.636465 | 3 | 0 | 3 |
| HEXIM2 | IL4 | 0.607135 | 3 | 0 | 3 |
| HEXIM2 | ACSS1 | 0.576 | 4 | 0 | 3 |
| HEXIM2 | F11-AS1 | 0.573866 | 3 | 0 | 3 |
| HEXIM2 | MKRN1 | 0.566183 | 3 | 0 | 3 |
| HEXIM2 | HOGA1 | 0.561246 | 4 | 0 | 3 |
| HEXIM2 | MDH1 | 0.55919 | 3 | 0 | 3 |
| HEXIM2 | THAP7 | 0.549194 | 4 | 0 | 3 |
| HEXIM2 | MAGIX | 0.548041 | 3 | 0 | 3 |
| HEXIM2 | THAP4 | 0.546898 | 3 | 0 | 3 |
| HEXIM2 | MIF4GD | 0.522579 | 5 | 0 | 3 |
| HEXIM2 | GOLGB1 | 0.521554 | 5 | 0 | 3 |
| HEXIM2 | HAGH | 0.515736 | 4 | 0 | 3 |
| HEXIM2 | USP54 | 0.513394 | 3 | 0 | 3 |
| HEXIM2 | NTHL1 | 0.500436 | 5 | 0 | 3 |
For details and further investigation, click here