| Full name: harakiri, BCL2 interacting protein | Alias Symbol: DP5 | ||
| Type: protein-coding gene | Cytoband: 12q24.22 | ||
| Entrez ID: 8739 | HGNC ID: HGNC:5185 | Ensembl Gene: ENSG00000135116 | OMIM ID: 603447 |
Screen Evidence:
| |||
HRK involved pathways:
| KEGG pathway | Description | View |
|---|---|---|
| hsa04210 | Apoptosis |
Expression of HRK:
| Dataset | Gene | EntrezID | Probe | Log2FC | Adj.pValue | Expression |
|---|---|---|---|---|---|---|
| GSE17351 | HRK | 8739 | 237187_at | 0.8696 | 0.1446 | |
| GSE20347 | HRK | 8739 | 206864_s_at | 0.0006 | 0.9976 | |
| GSE23400 | HRK | 8739 | 206865_at | -0.1794 | 0.0000 | |
| GSE26886 | HRK | 8739 | 206864_s_at | 1.1403 | 0.0119 | |
| GSE29001 | HRK | 8739 | 206865_at | -0.1525 | 0.2493 | |
| GSE38129 | HRK | 8739 | 206864_s_at | 0.0986 | 0.5684 | |
| GSE45670 | HRK | 8739 | 237187_at | 0.3650 | 0.0613 | |
| GSE53622 | HRK | 8739 | 48247 | 1.2383 | 0.0000 | |
| GSE53624 | HRK | 8739 | 48247 | 1.3749 | 0.0000 | |
| GSE63941 | HRK | 8739 | 206864_s_at | 1.3699 | 0.0527 | |
| GSE97050 | HRK | 8739 | A_23_P25194 | 0.4085 | 0.2362 | |
| SRP133303 | HRK | 8739 | RNAseq | 0.9688 | 0.0001 | |
| TCGA | HRK | 8739 | RNAseq | 2.2754 | 0.0008 |
Upregulated datasets: 4; Downregulated datasets: 0.
Survival by HRK expression:
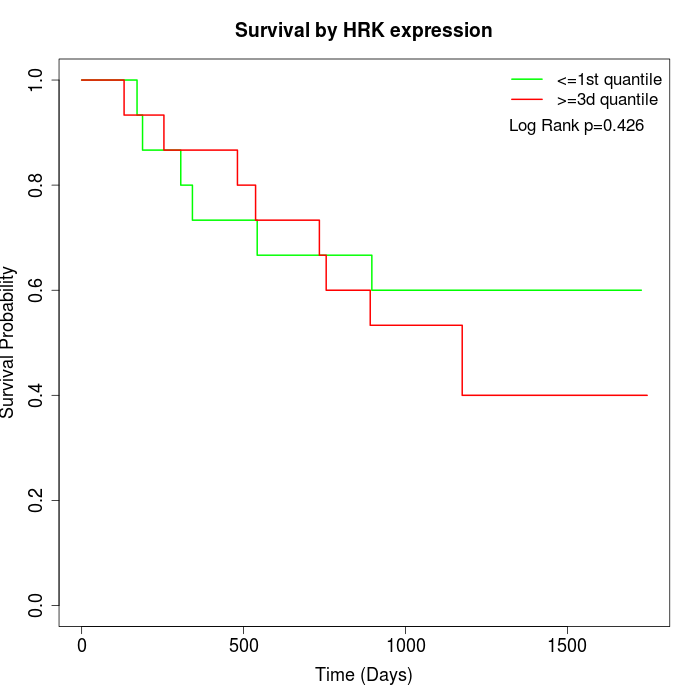 | 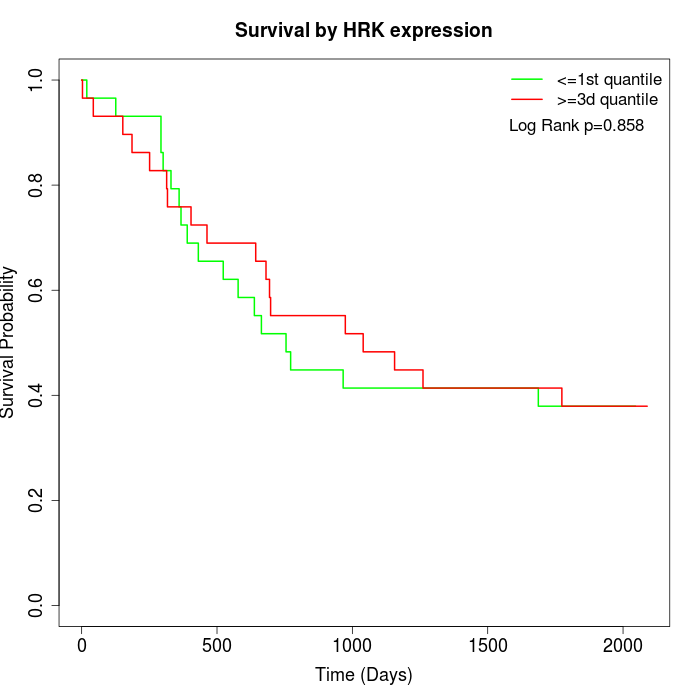 | 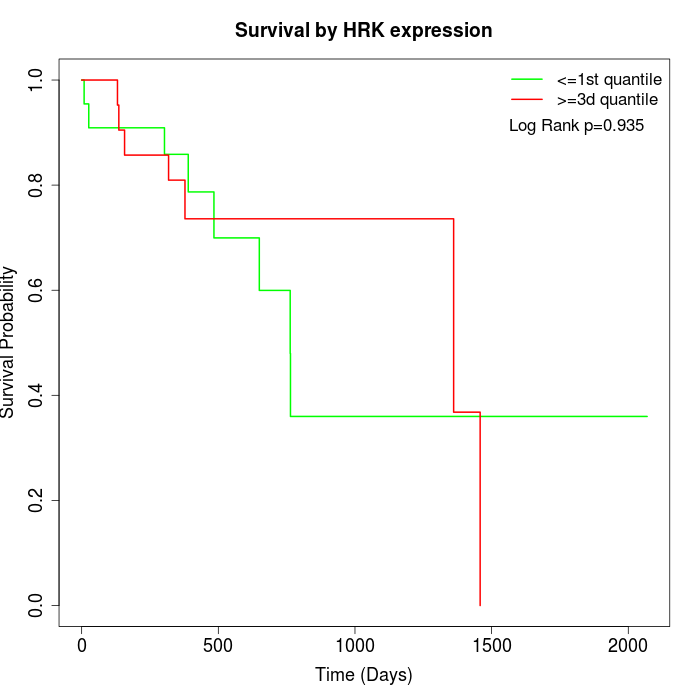 |
| GSE53622 | GSE53624 | TCGA |
Note: Click image to view full size file.
Copy number change of HRK:
| Dataset | Gene | EntrezID | Gain | Loss | Normal | Detail |
|---|---|---|---|---|---|---|
| GSE15526 | HRK | 8739 | 4 | 3 | 23 | |
| GSE20123 | HRK | 8739 | 4 | 3 | 23 | |
| GSE43470 | HRK | 8739 | 2 | 0 | 41 | |
| GSE46452 | HRK | 8739 | 9 | 1 | 49 | |
| GSE47630 | HRK | 8739 | 9 | 3 | 28 | |
| GSE54993 | HRK | 8739 | 0 | 5 | 65 | |
| GSE54994 | HRK | 8739 | 6 | 5 | 42 | |
| GSE60625 | HRK | 8739 | 0 | 0 | 11 | |
| GSE74703 | HRK | 8739 | 2 | 0 | 34 | |
| GSE74704 | HRK | 8739 | 2 | 2 | 16 | |
| TCGA | HRK | 8739 | 22 | 10 | 64 |
Total number of gains: 60; Total number of losses: 32; Total Number of normals: 396.
Somatic mutations of HRK:
Generating mutation plots.
Highly correlated genes for HRK:
Showing top 20/215 corelated genes with mean PCC>0.5.
| Gene1 | Gene2 | Mean PCC | Num. Datasets | Num. PCC<0 | Num. PCC>0.5 |
|---|---|---|---|---|---|
| HRK | PODXL2 | 0.80856 | 3 | 0 | 3 |
| HRK | TIGD5 | 0.79355 | 3 | 0 | 3 |
| HRK | STK11 | 0.776414 | 3 | 0 | 3 |
| HRK | CDC34 | 0.773884 | 3 | 0 | 3 |
| HRK | PDCD11 | 0.767501 | 3 | 0 | 3 |
| HRK | ITGA2B | 0.760985 | 3 | 0 | 3 |
| HRK | FBRSL1 | 0.753533 | 3 | 0 | 3 |
| HRK | ZNF205 | 0.749665 | 3 | 0 | 3 |
| HRK | TMEM120B | 0.734334 | 3 | 0 | 3 |
| HRK | MIIP | 0.707574 | 4 | 0 | 3 |
| HRK | FCRL2 | 0.705516 | 3 | 0 | 3 |
| HRK | PHGR1 | 0.696484 | 3 | 0 | 3 |
| HRK | WDR90 | 0.6949 | 4 | 0 | 3 |
| HRK | DUSP9 | 0.687588 | 3 | 0 | 3 |
| HRK | DOHH | 0.686977 | 3 | 0 | 3 |
| HRK | ZNF157 | 0.684758 | 3 | 0 | 3 |
| HRK | STK32C | 0.684514 | 3 | 0 | 3 |
| HRK | NUBP2 | 0.682824 | 3 | 0 | 3 |
| HRK | CEP131 | 0.674347 | 3 | 0 | 3 |
| HRK | CELSR3 | 0.668544 | 4 | 0 | 3 |
For details and further investigation, click here