| Full name: indolethylamine N-methyltransferase | Alias Symbol: | ||
| Type: protein-coding gene | Cytoband: 7p14.3 | ||
| Entrez ID: 11185 | HGNC ID: HGNC:6069 | Ensembl Gene: ENSG00000241644 | OMIM ID: 604854 |
Expression of INMT:
| Dataset | Gene | EntrezID | Probe | Log2FC | Adj.pValue | Expression |
|---|---|---|---|---|---|---|
| GSE17351 | INMT | 11185 | 224061_at | -1.2307 | 0.2461 | |
| GSE26886 | INMT | 11185 | 224061_at | 0.2355 | 0.0499 | |
| GSE45670 | INMT | 11185 | 224061_at | -1.4429 | 0.0000 | |
| GSE53622 | INMT | 11185 | 41618 | -0.7026 | 0.0000 | |
| GSE53624 | INMT | 11185 | 136834 | -1.2173 | 0.0000 | |
| GSE63941 | INMT | 11185 | 224061_at | -1.8025 | 0.0000 | |
| GSE77861 | INMT | 11185 | 224061_at | 0.0191 | 0.9067 | |
| GSE97050 | INMT | 11185 | A_33_P3347291 | -0.8735 | 0.1279 | |
| SRP007169 | INMT | 11185 | RNAseq | -0.5463 | 0.2541 | |
| SRP008496 | INMT | 11185 | RNAseq | 0.7963 | 0.0808 | |
| SRP064894 | INMT | 11185 | RNAseq | -0.9504 | 0.0066 | |
| SRP133303 | INMT | 11185 | RNAseq | -1.1503 | 0.0000 | |
| SRP159526 | INMT | 11185 | RNAseq | -0.9031 | 0.0321 | |
| SRP193095 | INMT | 11185 | RNAseq | 0.1919 | 0.1425 | |
| SRP219564 | INMT | 11185 | RNAseq | -1.0236 | 0.3849 | |
| TCGA | INMT | 11185 | RNAseq | -1.0219 | 0.0000 |
Upregulated datasets: 0; Downregulated datasets: 5.
Survival by INMT expression:
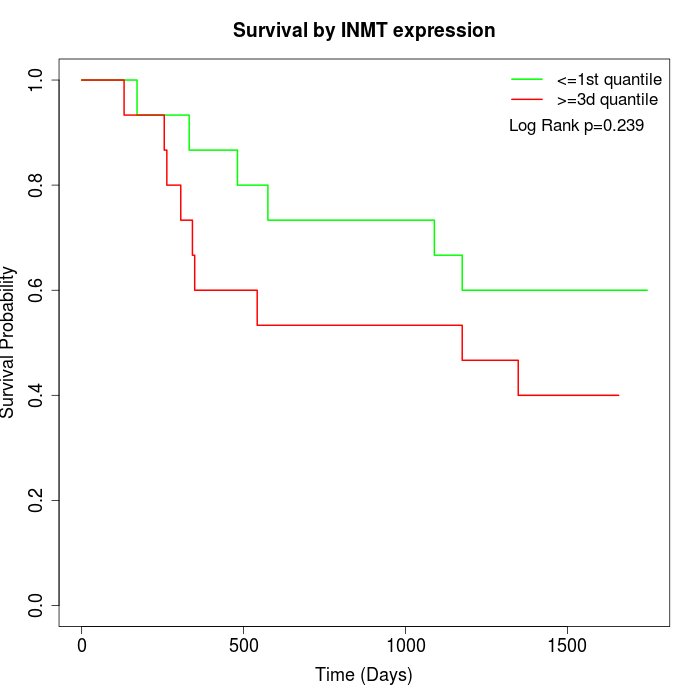 | 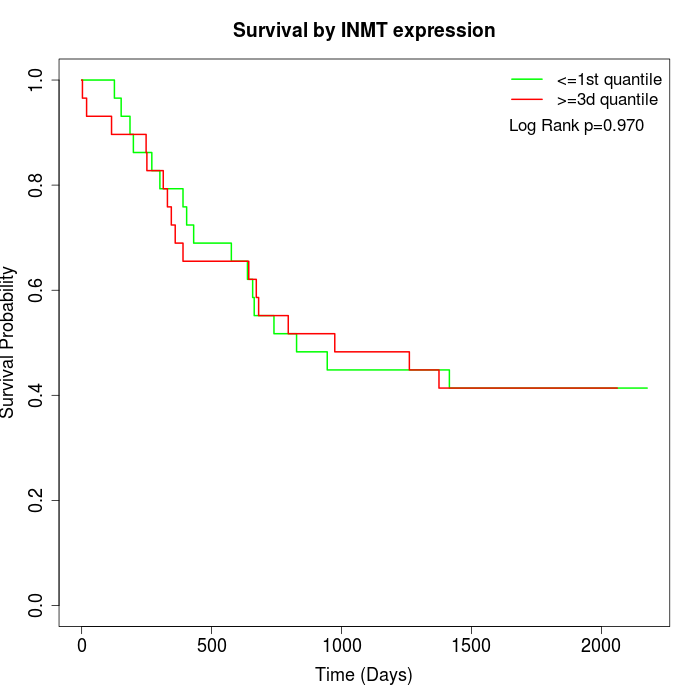 |  |
| GSE53622 | GSE53624 | TCGA |
Note: Click image to view full size file.
Copy number change of INMT:
| Dataset | Gene | EntrezID | Gain | Loss | Normal | Detail |
|---|---|---|---|---|---|---|
| GSE15526 | INMT | 11185 | 15 | 0 | 15 | |
| GSE20123 | INMT | 11185 | 15 | 0 | 15 | |
| GSE43470 | INMT | 11185 | 4 | 0 | 39 | |
| GSE46452 | INMT | 11185 | 11 | 1 | 47 | |
| GSE47630 | INMT | 11185 | 8 | 1 | 31 | |
| GSE54993 | INMT | 11185 | 0 | 6 | 64 | |
| GSE54994 | INMT | 11185 | 19 | 3 | 31 | |
| GSE60625 | INMT | 11185 | 0 | 0 | 11 | |
| GSE74703 | INMT | 11185 | 4 | 0 | 32 | |
| GSE74704 | INMT | 11185 | 9 | 0 | 11 | |
| TCGA | INMT | 11185 | 55 | 7 | 34 |
Total number of gains: 140; Total number of losses: 18; Total Number of normals: 330.
Somatic mutations of INMT:
Generating mutation plots.
Highly correlated genes for INMT:
Showing top 20/1085 corelated genes with mean PCC>0.5.
| Gene1 | Gene2 | Mean PCC | Num. Datasets | Num. PCC<0 | Num. PCC>0.5 |
|---|---|---|---|---|---|
| INMT | MRVI1 | 0.861491 | 7 | 0 | 7 |
| INMT | SLIT3 | 0.840284 | 4 | 0 | 4 |
| INMT | MYOCD | 0.840009 | 7 | 0 | 7 |
| INMT | FAM13C | 0.838988 | 4 | 0 | 4 |
| INMT | JPH2 | 0.833909 | 4 | 0 | 4 |
| INMT | COX7A1 | 0.830899 | 7 | 0 | 7 |
| INMT | CCDC69 | 0.818591 | 6 | 0 | 6 |
| INMT | NKX6-1 | 0.816564 | 4 | 0 | 4 |
| INMT | OLFML1 | 0.813554 | 5 | 0 | 5 |
| INMT | JAM2 | 0.813401 | 6 | 0 | 6 |
| INMT | ITGA1 | 0.807674 | 5 | 0 | 5 |
| INMT | ARHGAP6 | 0.806855 | 6 | 0 | 6 |
| INMT | GYPC | 0.80683 | 6 | 0 | 6 |
| INMT | PEG3 | 0.802288 | 4 | 0 | 4 |
| INMT | ANK2 | 0.801566 | 6 | 0 | 6 |
| INMT | NEGR1 | 0.797197 | 6 | 0 | 6 |
| INMT | XKR4 | 0.791134 | 5 | 0 | 5 |
| INMT | TMEM178A | 0.790752 | 5 | 0 | 5 |
| INMT | SMTN | 0.788726 | 5 | 0 | 5 |
| INMT | PPP1R12B | 0.788092 | 6 | 0 | 6 |
For details and further investigation, click here