| Full name: integrin subunit alpha 1 | Alias Symbol: VLA1|CD49a | ||
| Type: protein-coding gene | Cytoband: 5q11.2 | ||
| Entrez ID: 3672 | HGNC ID: HGNC:6134 | Ensembl Gene: ENSG00000213949 | OMIM ID: 192968 |
ITGA1 involved pathways:
| KEGG pathway | Description | View |
|---|---|---|
| hsa04151 | PI3K-Akt signaling pathway | |
| hsa04510 | Focal adhesion | |
| hsa04810 | Regulation of actin cytoskeleton |
Expression of ITGA1:
| Dataset | Gene | EntrezID | Probe | Log2FC | Adj.pValue | Expression |
|---|---|---|---|---|---|---|
| GSE17351 | ITGA1 | 3672 | 214660_at | -1.2599 | 0.2756 | |
| GSE20347 | ITGA1 | 3672 | 214660_at | 0.0213 | 0.9310 | |
| GSE23400 | ITGA1 | 3672 | 214660_at | -0.0268 | 0.7160 | |
| GSE26886 | ITGA1 | 3672 | 1560359_at | 0.2908 | 0.1285 | |
| GSE29001 | ITGA1 | 3672 | 214660_at | 0.3561 | 0.2304 | |
| GSE38129 | ITGA1 | 3672 | 214660_at | -0.2945 | 0.3469 | |
| GSE45670 | ITGA1 | 3672 | 1560359_at | -2.4050 | 0.0000 | |
| GSE53622 | ITGA1 | 3672 | 55855 | -0.3019 | 0.0524 | |
| GSE53624 | ITGA1 | 3672 | 55855 | 0.2773 | 0.0511 | |
| GSE63941 | ITGA1 | 3672 | 214660_at | -3.8803 | 0.0000 | |
| GSE77861 | ITGA1 | 3672 | 1560359_at | 0.0642 | 0.4941 | |
| GSE97050 | ITGA1 | 3672 | A_33_P3353791 | -0.7040 | 0.1239 | |
| SRP007169 | ITGA1 | 3672 | RNAseq | 2.6504 | 0.0000 | |
| SRP008496 | ITGA1 | 3672 | RNAseq | 3.2697 | 0.0000 | |
| SRP064894 | ITGA1 | 3672 | RNAseq | 0.2252 | 0.4555 | |
| SRP133303 | ITGA1 | 3672 | RNAseq | 0.3783 | 0.2681 | |
| SRP159526 | ITGA1 | 3672 | RNAseq | -0.4777 | 0.2888 | |
| SRP193095 | ITGA1 | 3672 | RNAseq | 0.9321 | 0.0003 | |
| SRP219564 | ITGA1 | 3672 | RNAseq | -0.7165 | 0.3614 | |
| TCGA | ITGA1 | 3672 | RNAseq | -0.3219 | 0.0072 |
Upregulated datasets: 2; Downregulated datasets: 2.
Survival by ITGA1 expression:
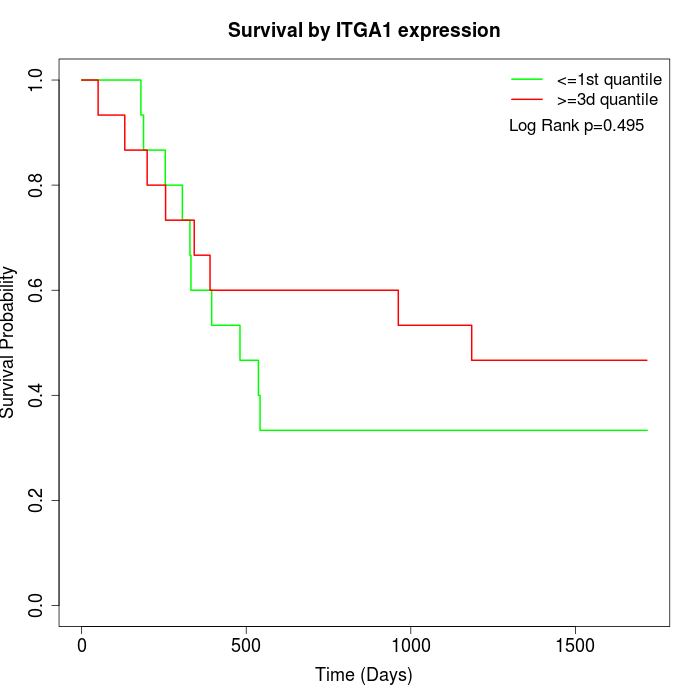 | 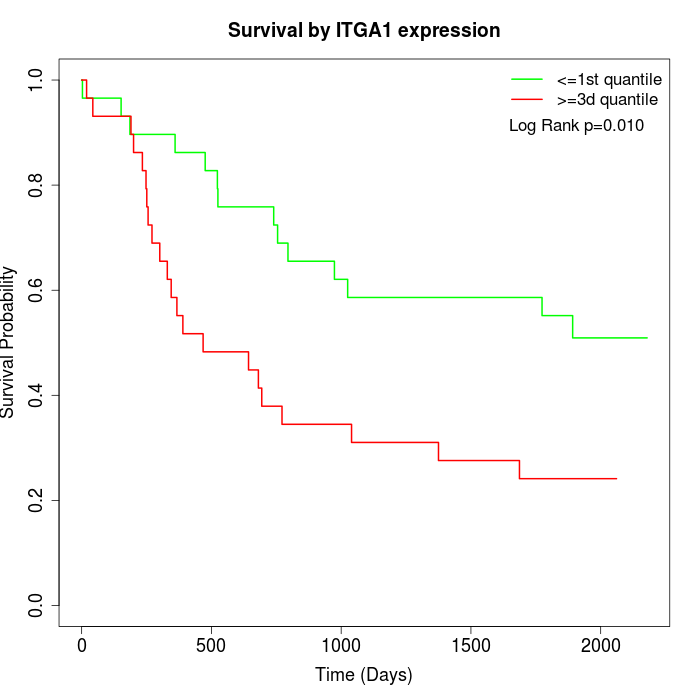 | 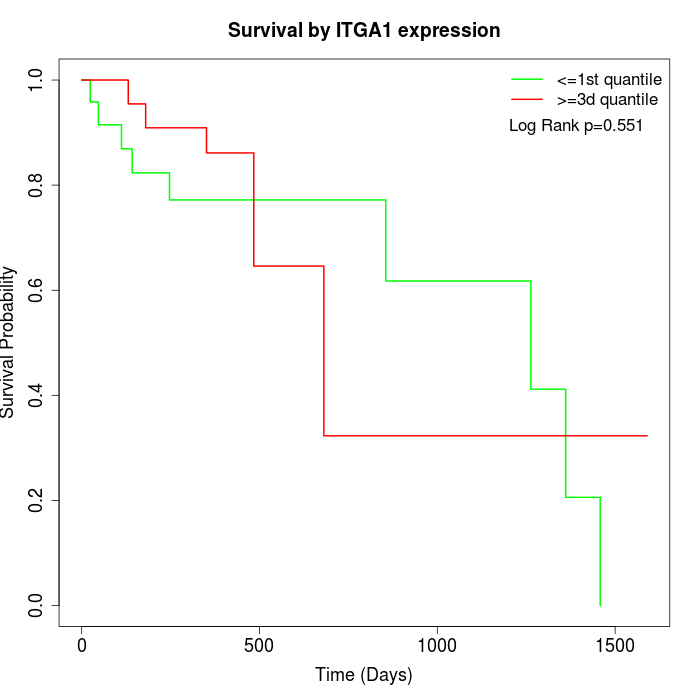 |
| GSE53622 | GSE53624 | TCGA |
Note: Click image to view full size file.
Copy number change of ITGA1:
| Dataset | Gene | EntrezID | Gain | Loss | Normal | Detail |
|---|---|---|---|---|---|---|
| GSE15526 | ITGA1 | 3672 | 2 | 11 | 17 | |
| GSE20123 | ITGA1 | 3672 | 2 | 11 | 17 | |
| GSE43470 | ITGA1 | 3672 | 1 | 12 | 30 | |
| GSE46452 | ITGA1 | 3672 | 1 | 27 | 31 | |
| GSE47630 | ITGA1 | 3672 | 2 | 16 | 22 | |
| GSE54993 | ITGA1 | 3672 | 8 | 1 | 61 | |
| GSE54994 | ITGA1 | 3672 | 5 | 17 | 31 | |
| GSE60625 | ITGA1 | 3672 | 0 | 0 | 11 | |
| GSE74703 | ITGA1 | 3672 | 1 | 9 | 26 | |
| GSE74704 | ITGA1 | 3672 | 2 | 5 | 13 | |
| TCGA | ITGA1 | 3672 | 11 | 45 | 40 |
Total number of gains: 35; Total number of losses: 154; Total Number of normals: 299.
Somatic mutations of ITGA1:
Generating mutation plots.
Highly correlated genes for ITGA1:
Showing top 20/1136 corelated genes with mean PCC>0.5.
| Gene1 | Gene2 | Mean PCC | Num. Datasets | Num. PCC<0 | Num. PCC>0.5 |
|---|---|---|---|---|---|
| ITGA1 | FIBIN | 0.880182 | 4 | 0 | 4 |
| ITGA1 | AFF3 | 0.877443 | 3 | 0 | 3 |
| ITGA1 | ZNF583 | 0.846324 | 3 | 0 | 3 |
| ITGA1 | PRKG1 | 0.84432 | 7 | 0 | 7 |
| ITGA1 | SYNC | 0.833803 | 7 | 0 | 7 |
| ITGA1 | SLC4A4 | 0.824151 | 4 | 0 | 4 |
| ITGA1 | ASB5 | 0.819933 | 5 | 0 | 5 |
| ITGA1 | RASSF3 | 0.81214 | 4 | 0 | 4 |
| ITGA1 | ZEB1 | 0.80879 | 3 | 0 | 3 |
| ITGA1 | INMT | 0.807674 | 5 | 0 | 5 |
| ITGA1 | ZBTB47 | 0.804458 | 3 | 0 | 3 |
| ITGA1 | CNTN3 | 0.80285 | 4 | 0 | 4 |
| ITGA1 | DIXDC1 | 0.793725 | 9 | 0 | 9 |
| ITGA1 | TBX5 | 0.793147 | 7 | 0 | 6 |
| ITGA1 | SGIP1 | 0.785217 | 7 | 0 | 7 |
| ITGA1 | GREM2 | 0.783922 | 4 | 0 | 4 |
| ITGA1 | CLMP | 0.781607 | 6 | 0 | 6 |
| ITGA1 | ZCCHC24 | 0.7749 | 10 | 0 | 9 |
| ITGA1 | ZNF132 | 0.772326 | 3 | 0 | 3 |
| ITGA1 | LAMA4 | 0.770175 | 12 | 0 | 12 |
For details and further investigation, click here