| Full name: LLGL scribble cell polarity complex component 1 | Alias Symbol: Lgl1|Mgl1 | ||
| Type: protein-coding gene | Cytoband: 17p11.2 | ||
| Entrez ID: 3996 | HGNC ID: HGNC:6628 | Ensembl Gene: ENSG00000131899 | OMIM ID: 600966 |
LLGL1 involved pathways:
| KEGG pathway | Description | View |
|---|---|---|
| hsa04390 | Hippo signaling pathway | |
| hsa04530 | Tight junction |
Expression of LLGL1:
| Dataset | Gene | EntrezID | Probe | Log2FC | Adj.pValue | Expression |
|---|---|---|---|---|---|---|
| GSE17351 | LLGL1 | 3996 | 236594_at | 0.2267 | 0.3914 | |
| GSE20347 | LLGL1 | 3996 | 206123_at | 0.0693 | 0.4096 | |
| GSE23400 | LLGL1 | 3996 | 206123_at | -0.0168 | 0.6999 | |
| GSE26886 | LLGL1 | 3996 | 236594_at | -0.2149 | 0.3047 | |
| GSE29001 | LLGL1 | 3996 | 206123_at | -0.1727 | 0.4769 | |
| GSE38129 | LLGL1 | 3996 | 206123_at | -0.0632 | 0.4474 | |
| GSE45670 | LLGL1 | 3996 | 236594_at | 0.2669 | 0.0481 | |
| GSE53622 | LLGL1 | 3996 | 36574 | -0.2830 | 0.2108 | |
| GSE53624 | LLGL1 | 3996 | 36574 | -0.1434 | 0.3189 | |
| GSE63941 | LLGL1 | 3996 | 236594_at | -1.3743 | 0.0180 | |
| GSE77861 | LLGL1 | 3996 | 236594_at | -0.1196 | 0.2992 | |
| SRP007169 | LLGL1 | 3996 | RNAseq | -1.1599 | 0.0001 | |
| SRP008496 | LLGL1 | 3996 | RNAseq | -0.9400 | 0.0000 | |
| SRP064894 | LLGL1 | 3996 | RNAseq | 0.5528 | 0.0292 | |
| SRP133303 | LLGL1 | 3996 | RNAseq | -0.0807 | 0.6510 | |
| SRP159526 | LLGL1 | 3996 | RNAseq | -0.0224 | 0.9291 | |
| SRP193095 | LLGL1 | 3996 | RNAseq | 0.1937 | 0.2035 | |
| SRP219564 | LLGL1 | 3996 | RNAseq | 0.0439 | 0.8964 | |
| TCGA | LLGL1 | 3996 | RNAseq | 0.1048 | 0.0857 |
Upregulated datasets: 0; Downregulated datasets: 2.
Survival by LLGL1 expression:
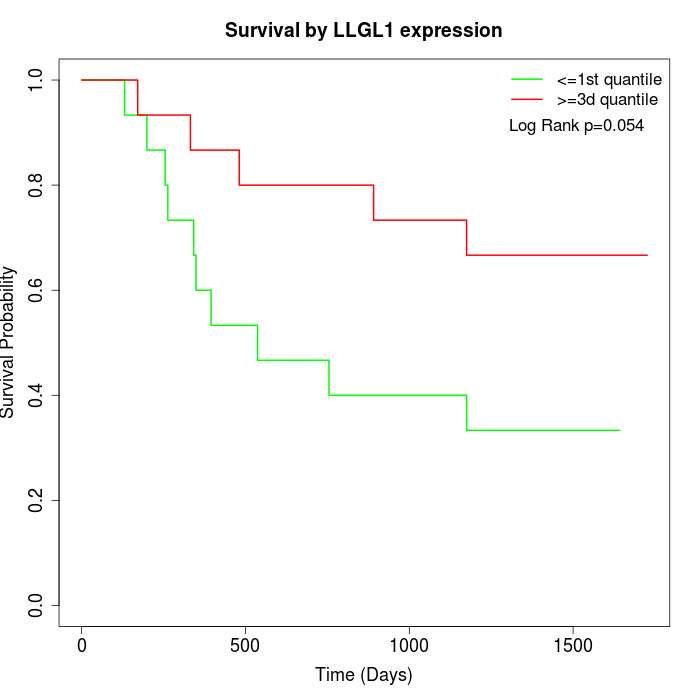 | 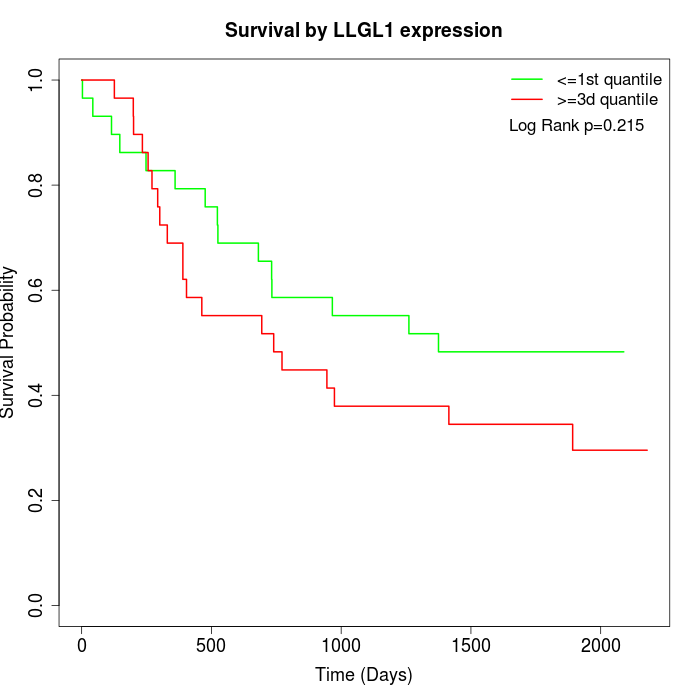 | 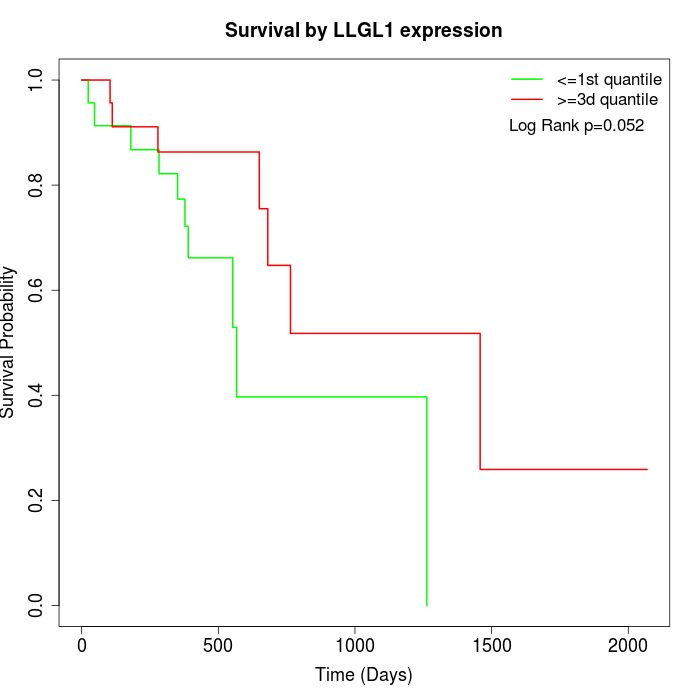 |
| GSE53622 | GSE53624 | TCGA |
Note: Click image to view full size file.
Copy number change of LLGL1:
| Dataset | Gene | EntrezID | Gain | Loss | Normal | Detail |
|---|---|---|---|---|---|---|
| GSE15526 | LLGL1 | 3996 | 3 | 3 | 24 | |
| GSE20123 | LLGL1 | 3996 | 3 | 4 | 23 | |
| GSE43470 | LLGL1 | 3996 | 1 | 5 | 37 | |
| GSE46452 | LLGL1 | 3996 | 34 | 1 | 24 | |
| GSE47630 | LLGL1 | 3996 | 7 | 1 | 32 | |
| GSE54993 | LLGL1 | 3996 | 3 | 3 | 64 | |
| GSE54994 | LLGL1 | 3996 | 6 | 6 | 41 | |
| GSE60625 | LLGL1 | 3996 | 4 | 0 | 7 | |
| GSE74703 | LLGL1 | 3996 | 1 | 2 | 33 | |
| GSE74704 | LLGL1 | 3996 | 2 | 1 | 17 | |
| TCGA | LLGL1 | 3996 | 19 | 23 | 54 |
Total number of gains: 83; Total number of losses: 49; Total Number of normals: 356.
Somatic mutations of LLGL1:
Generating mutation plots.
Highly correlated genes for LLGL1:
Showing top 20/95 corelated genes with mean PCC>0.5.
| Gene1 | Gene2 | Mean PCC | Num. Datasets | Num. PCC<0 | Num. PCC>0.5 |
|---|---|---|---|---|---|
| LLGL1 | SLCO1C1 | 0.691274 | 3 | 0 | 3 |
| LLGL1 | CCDC7 | 0.664271 | 3 | 0 | 3 |
| LLGL1 | MAS1 | 0.66101 | 5 | 0 | 5 |
| LLGL1 | RUNX2 | 0.660744 | 4 | 0 | 3 |
| LLGL1 | KCNJ10 | 0.648713 | 3 | 0 | 3 |
| LLGL1 | OR2S2 | 0.637927 | 4 | 0 | 3 |
| LLGL1 | PRSS53 | 0.637905 | 3 | 0 | 3 |
| LLGL1 | TP53I11 | 0.636921 | 4 | 0 | 3 |
| LLGL1 | RGSL1 | 0.629674 | 3 | 0 | 3 |
| LLGL1 | PDX1 | 0.623127 | 3 | 0 | 3 |
| LLGL1 | OR1E1 | 0.618559 | 4 | 0 | 4 |
| LLGL1 | IFNA4 | 0.616092 | 3 | 0 | 3 |
| LLGL1 | FBXO46 | 0.612957 | 6 | 0 | 5 |
| LLGL1 | FOXN3-AS2 | 0.6129 | 5 | 0 | 4 |
| LLGL1 | RCVRN | 0.61227 | 4 | 0 | 3 |
| LLGL1 | GPR27 | 0.611954 | 5 | 0 | 4 |
| LLGL1 | ZKSCAN7 | 0.607869 | 3 | 0 | 3 |
| LLGL1 | SCN11A | 0.60764 | 3 | 0 | 3 |
| LLGL1 | NTNG1 | 0.606634 | 3 | 0 | 3 |
| LLGL1 | TUBB4A | 0.603447 | 3 | 0 | 3 |
For details and further investigation, click here