| Full name: MAS1 proto-oncogene, G protein-coupled receptor | Alias Symbol: | ||
| Type: protein-coding gene | Cytoband: 6q25.3 | ||
| Entrez ID: 4142 | HGNC ID: HGNC:6899 | Ensembl Gene: ENSG00000130368 | OMIM ID: 165180 |
| Related drugs: TXA127... [more] | |||
Expression of MAS1:
| Dataset | Gene | EntrezID | Probe | Log2FC | Adj.pValue | Expression |
|---|---|---|---|---|---|---|
| GSE17351 | MAS1 | 4142 | 208210_at | 0.0955 | 0.7904 | |
| GSE20347 | MAS1 | 4142 | 208210_at | 0.0222 | 0.8636 | |
| GSE23400 | MAS1 | 4142 | 208210_at | -0.1965 | 0.0001 | |
| GSE26886 | MAS1 | 4142 | 208210_at | -0.1904 | 0.1050 | |
| GSE29001 | MAS1 | 4142 | 208210_at | -0.1328 | 0.5644 | |
| GSE38129 | MAS1 | 4142 | 208210_at | -0.1856 | 0.0595 | |
| GSE45670 | MAS1 | 4142 | 208210_at | 0.0074 | 0.9583 | |
| GSE53622 | MAS1 | 4142 | 97229 | 0.2454 | 0.1966 | |
| GSE53624 | MAS1 | 4142 | 97229 | 0.2641 | 0.0166 | |
| GSE63941 | MAS1 | 4142 | 208210_at | -0.1836 | 0.3378 | |
| GSE77861 | MAS1 | 4142 | 208210_at | -0.1347 | 0.3505 | |
| SRP064894 | MAS1 | 4142 | RNAseq | 0.5531 | 0.0292 | |
| SRP133303 | MAS1 | 4142 | RNAseq | 0.2818 | 0.0773 | |
| SRP159526 | MAS1 | 4142 | RNAseq | 0.2950 | 0.6356 | |
| SRP193095 | MAS1 | 4142 | RNAseq | 0.0981 | 0.5449 | |
| SRP219564 | MAS1 | 4142 | RNAseq | 0.2836 | 0.4312 |
Upregulated datasets: 0; Downregulated datasets: 0.
Survival by MAS1 expression:
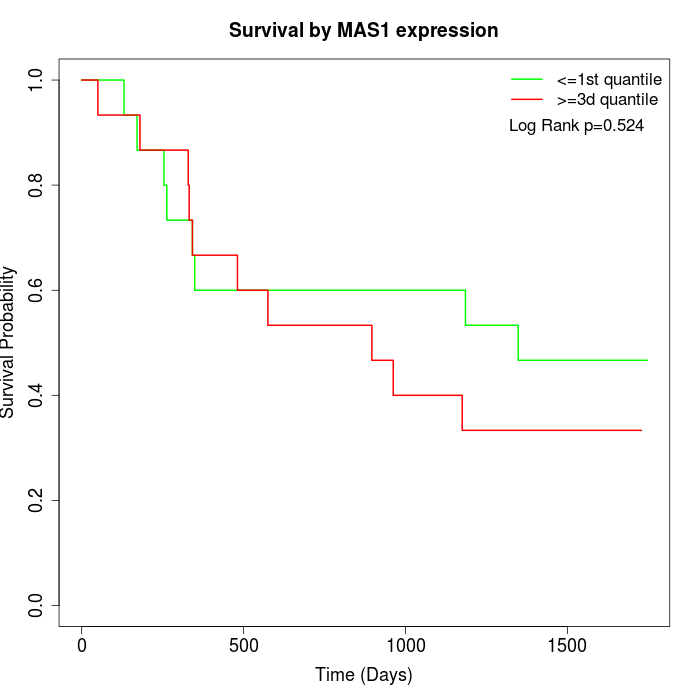 | 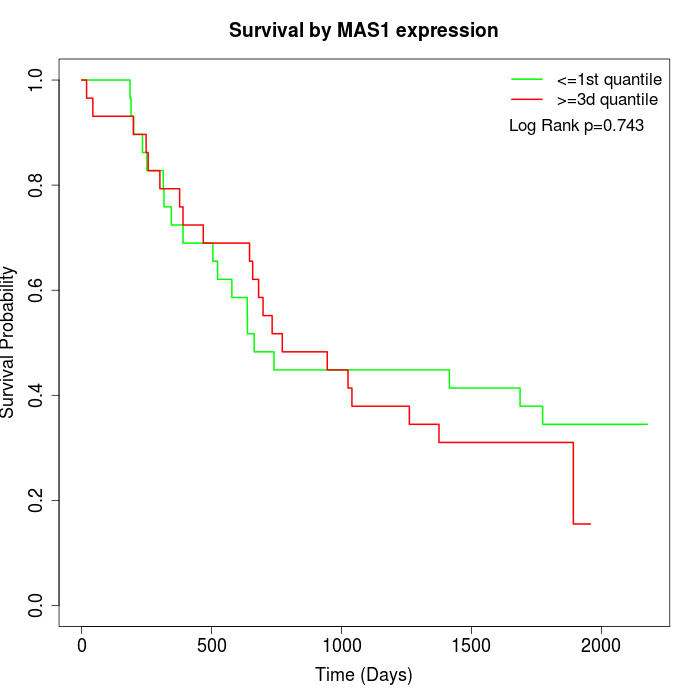 | 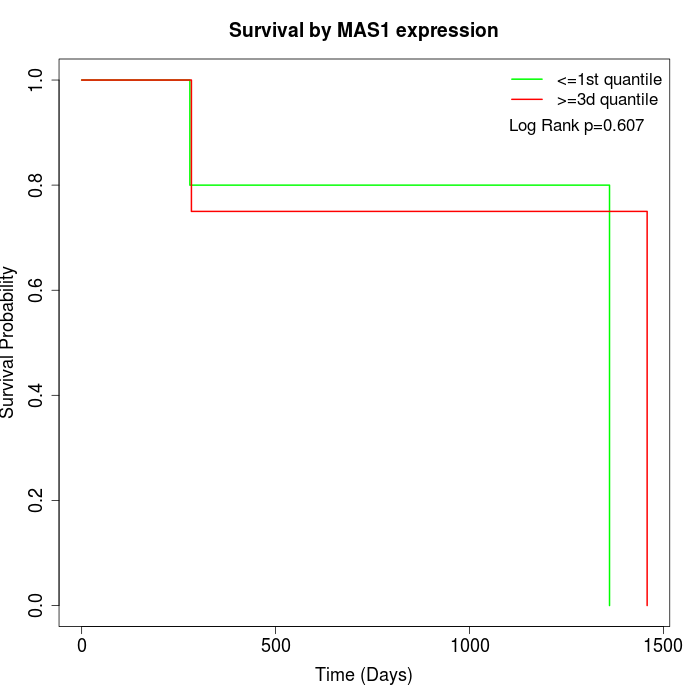 |
| GSE53622 | GSE53624 | TCGA |
Note: Click image to view full size file.
Copy number change of MAS1:
| Dataset | Gene | EntrezID | Gain | Loss | Normal | Detail |
|---|---|---|---|---|---|---|
| GSE15526 | MAS1 | 4142 | 1 | 5 | 24 | |
| GSE20123 | MAS1 | 4142 | 1 | 4 | 25 | |
| GSE43470 | MAS1 | 4142 | 4 | 0 | 39 | |
| GSE46452 | MAS1 | 4142 | 3 | 10 | 46 | |
| GSE47630 | MAS1 | 4142 | 9 | 4 | 27 | |
| GSE54993 | MAS1 | 4142 | 4 | 4 | 62 | |
| GSE54994 | MAS1 | 4142 | 8 | 8 | 37 | |
| GSE60625 | MAS1 | 4142 | 0 | 1 | 10 | |
| GSE74703 | MAS1 | 4142 | 4 | 0 | 32 | |
| GSE74704 | MAS1 | 4142 | 0 | 2 | 18 | |
| TCGA | MAS1 | 4142 | 13 | 22 | 61 |
Total number of gains: 47; Total number of losses: 60; Total Number of normals: 381.
Somatic mutations of MAS1:
Generating mutation plots.
Highly correlated genes for MAS1:
Showing top 20/873 corelated genes with mean PCC>0.5.
| Gene1 | Gene2 | Mean PCC | Num. Datasets | Num. PCC<0 | Num. PCC>0.5 |
|---|---|---|---|---|---|
| MAS1 | RHAG | 0.736057 | 3 | 0 | 3 |
| MAS1 | SLC6A12 | 0.734569 | 5 | 0 | 5 |
| MAS1 | NXPE4 | 0.729775 | 5 | 0 | 5 |
| MAS1 | GPLD1 | 0.710861 | 3 | 0 | 3 |
| MAS1 | KRT38 | 0.704535 | 4 | 0 | 4 |
| MAS1 | PDE3B | 0.704335 | 4 | 0 | 4 |
| MAS1 | NTSR2 | 0.702847 | 4 | 0 | 4 |
| MAS1 | ACR | 0.693949 | 5 | 0 | 5 |
| MAS1 | MUC5AC | 0.693897 | 5 | 0 | 4 |
| MAS1 | CYP11B1 | 0.693117 | 5 | 0 | 5 |
| MAS1 | GYPB | 0.692876 | 5 | 0 | 5 |
| MAS1 | CYP19A1 | 0.687599 | 5 | 0 | 4 |
| MAS1 | PRODH2 | 0.686852 | 5 | 0 | 5 |
| MAS1 | KLF14 | 0.684229 | 4 | 0 | 4 |
| MAS1 | SPO11 | 0.682655 | 3 | 0 | 3 |
| MAS1 | IL17A | 0.681558 | 4 | 0 | 4 |
| MAS1 | CETN1 | 0.680335 | 4 | 0 | 4 |
| MAS1 | KHDRBS2 | 0.679665 | 4 | 0 | 4 |
| MAS1 | FXYD7 | 0.679557 | 5 | 0 | 5 |
| MAS1 | ARHGEF38 | 0.679251 | 7 | 0 | 5 |
For details and further investigation, click here