| Full name: lipin 3 | Alias Symbol: SMP2 | ||
| Type: protein-coding gene | Cytoband: 20q12 | ||
| Entrez ID: 64900 | HGNC ID: HGNC:14451 | Ensembl Gene: ENSG00000132793 | OMIM ID: 605520 |
| Drug and gene relationship at DGIdb | |||
Expression of LPIN3:
| Dataset | Gene | EntrezID | Probe | Log2FC | Adj.pValue | Expression |
|---|---|---|---|---|---|---|
| GSE17351 | LPIN3 | 64900 | 232966_at | 0.0040 | 0.9905 | |
| GSE26886 | LPIN3 | 64900 | 232966_at | 0.1351 | 0.1877 | |
| GSE45670 | LPIN3 | 64900 | 232966_at | 0.0410 | 0.7589 | |
| GSE63941 | LPIN3 | 64900 | 232966_at | 0.2558 | 0.1366 | |
| GSE77861 | LPIN3 | 64900 | 232966_at | -0.0533 | 0.6542 | |
| GSE97050 | LPIN3 | 64900 | A_33_P3393341 | -0.1268 | 0.5723 | |
| SRP007169 | LPIN3 | 64900 | RNAseq | -0.7819 | 0.0527 | |
| SRP008496 | LPIN3 | 64900 | RNAseq | -0.5371 | 0.0778 | |
| SRP064894 | LPIN3 | 64900 | RNAseq | -0.1788 | 0.4171 | |
| SRP133303 | LPIN3 | 64900 | RNAseq | -0.2317 | 0.2692 | |
| SRP159526 | LPIN3 | 64900 | RNAseq | -0.9581 | 0.0149 | |
| SRP193095 | LPIN3 | 64900 | RNAseq | -0.1646 | 0.3546 | |
| SRP219564 | LPIN3 | 64900 | RNAseq | -0.3367 | 0.4472 | |
| TCGA | LPIN3 | 64900 | RNAseq | 0.1407 | 0.1074 |
Upregulated datasets: 0; Downregulated datasets: 0.
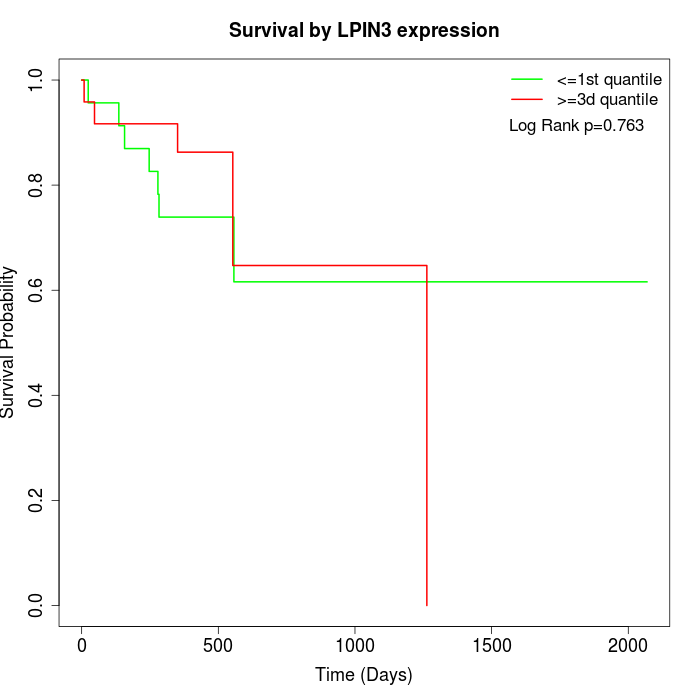
Survival by LPIN3 expression:
Note: Click image to view full size file.
Copy number change of LPIN3:
| Dataset | Gene | EntrezID | Gain | Loss | Normal | Detail |
|---|---|---|---|---|---|---|
| GSE15526 | LPIN3 | 64900 | 13 | 1 | 16 | |
| GSE20123 | LPIN3 | 64900 | 13 | 1 | 16 | |
| GSE43470 | LPIN3 | 64900 | 13 | 0 | 30 | |
| GSE46452 | LPIN3 | 64900 | 29 | 0 | 30 | |
| GSE47630 | LPIN3 | 64900 | 24 | 0 | 16 | |
| GSE54993 | LPIN3 | 64900 | 0 | 17 | 53 | |
| GSE54994 | LPIN3 | 64900 | 24 | 0 | 29 | |
| GSE60625 | LPIN3 | 64900 | 0 | 0 | 11 | |
| GSE74703 | LPIN3 | 64900 | 10 | 0 | 26 | |
| GSE74704 | LPIN3 | 64900 | 9 | 0 | 11 | |
| TCGA | LPIN3 | 64900 | 47 | 4 | 45 |
Total number of gains: 182; Total number of losses: 23; Total Number of normals: 283.
Somatic mutations of LPIN3:
Generating mutation plots.
Highly correlated genes for LPIN3:
Showing top 20/94 corelated genes with mean PCC>0.5.
| Gene1 | Gene2 | Mean PCC | Num. Datasets | Num. PCC<0 | Num. PCC>0.5 |
|---|---|---|---|---|---|
| LPIN3 | QPCTL | 0.794669 | 3 | 0 | 3 |
| LPIN3 | ZNF467 | 0.732511 | 3 | 0 | 3 |
| LPIN3 | HIF1A | 0.722415 | 3 | 0 | 3 |
| LPIN3 | MIER2 | 0.717626 | 3 | 0 | 3 |
| LPIN3 | DIS3L2 | 0.710306 | 3 | 0 | 3 |
| LPIN3 | PRPS1L1 | 0.705042 | 3 | 0 | 3 |
| LPIN3 | C6orf163 | 0.690896 | 3 | 0 | 3 |
| LPIN3 | KRT81 | 0.68536 | 3 | 0 | 3 |
| LPIN3 | TRADD | 0.684145 | 4 | 0 | 3 |
| LPIN3 | KCNC4 | 0.673239 | 3 | 0 | 3 |
| LPIN3 | TIMM23 | 0.662103 | 3 | 0 | 3 |
| LPIN3 | C12orf40 | 0.659421 | 3 | 0 | 3 |
| LPIN3 | SPI1 | 0.655042 | 4 | 0 | 4 |
| LPIN3 | CDC14A | 0.651509 | 4 | 0 | 4 |
| LPIN3 | IRF2BP1 | 0.645424 | 4 | 0 | 3 |
| LPIN3 | TRMT61A | 0.642303 | 3 | 0 | 3 |
| LPIN3 | ERC2-IT1 | 0.6411 | 3 | 0 | 3 |
| LPIN3 | CAMTA2 | 0.640806 | 3 | 0 | 3 |
| LPIN3 | C16orf86 | 0.640311 | 3 | 0 | 3 |
| LPIN3 | EGR2 | 0.639763 | 3 | 0 | 3 |
For details and further investigation, click here
