| Full name: leukocyte specific transcript 1 | Alias Symbol: LST-1|B144|D6S49E | ||
| Type: protein-coding gene | Cytoband: 6p21.33 | ||
| Entrez ID: 7940 | HGNC ID: HGNC:14189 | Ensembl Gene: ENSG00000204482 | OMIM ID: 109170 |
Expression of LST1:
| Dataset | Gene | EntrezID | Probe | Log2FC | Adj.pValue | Expression |
|---|---|---|---|---|---|---|
| GSE17351 | LST1 | 7940 | 214574_x_at | 0.2195 | 0.7625 | |
| GSE20347 | LST1 | 7940 | 214574_x_at | -0.2657 | 0.0224 | |
| GSE23400 | LST1 | 7940 | 214574_x_at | -0.0640 | 0.2917 | |
| GSE26886 | LST1 | 7940 | 214574_x_at | -0.3523 | 0.0857 | |
| GSE29001 | LST1 | 7940 | 214574_x_at | -0.3013 | 0.0988 | |
| GSE38129 | LST1 | 7940 | 214574_x_at | -0.1017 | 0.5008 | |
| GSE45670 | LST1 | 7940 | 214574_x_at | -0.1434 | 0.5072 | |
| GSE53622 | LST1 | 7940 | 57734 | -0.2054 | 0.0000 | |
| GSE53624 | LST1 | 7940 | 57734 | -0.4212 | 0.0000 | |
| GSE63941 | LST1 | 7940 | 215633_x_at | 0.3356 | 0.0518 | |
| GSE77861 | LST1 | 7940 | 215633_x_at | -0.2372 | 0.1692 | |
| GSE97050 | LST1 | 7940 | A_24_P103469 | 0.3089 | 0.2852 | |
| SRP007169 | LST1 | 7940 | RNAseq | 0.8658 | 0.2935 | |
| SRP064894 | LST1 | 7940 | RNAseq | 0.8723 | 0.0163 | |
| SRP133303 | LST1 | 7940 | RNAseq | 0.0809 | 0.7856 | |
| SRP159526 | LST1 | 7940 | RNAseq | -0.5105 | 0.4539 | |
| SRP193095 | LST1 | 7940 | RNAseq | -0.0182 | 0.9388 | |
| SRP219564 | LST1 | 7940 | RNAseq | 0.8946 | 0.0572 | |
| TCGA | LST1 | 7940 | RNAseq | 0.5495 | 0.0022 |
Upregulated datasets: 0; Downregulated datasets: 0.
Survival by LST1 expression:
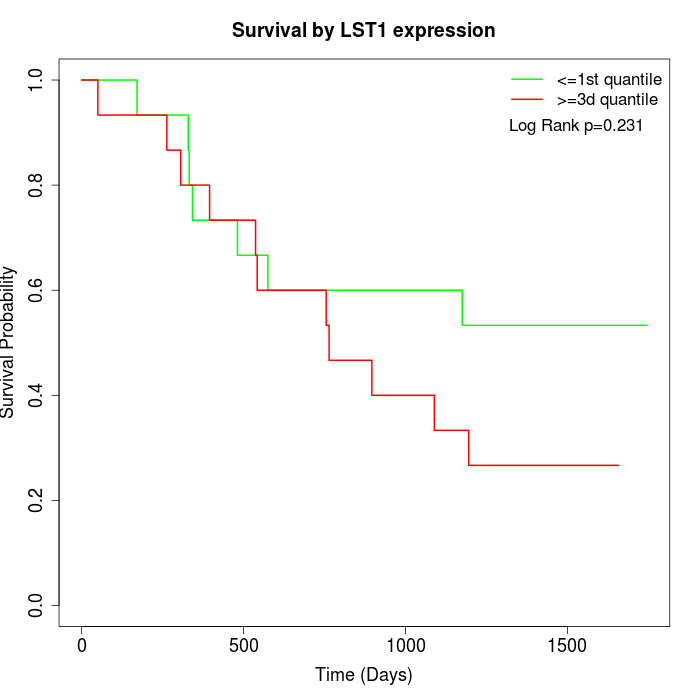 | 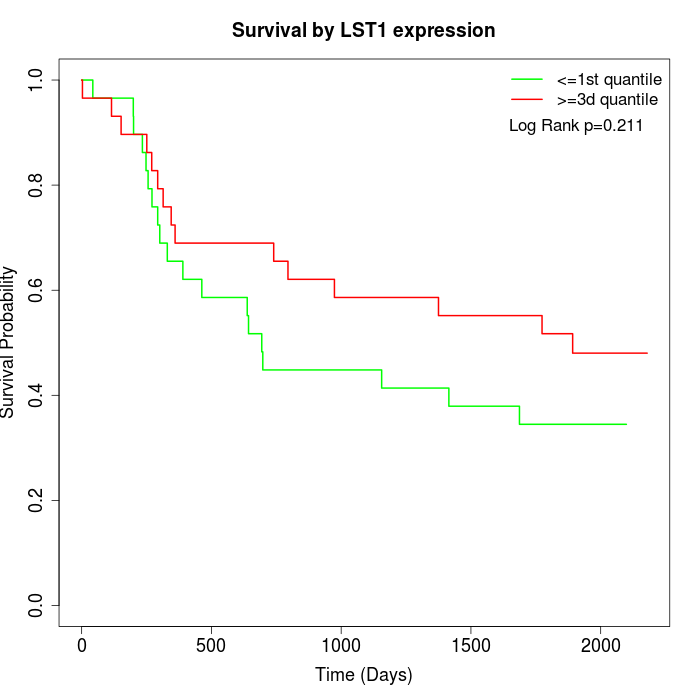 | 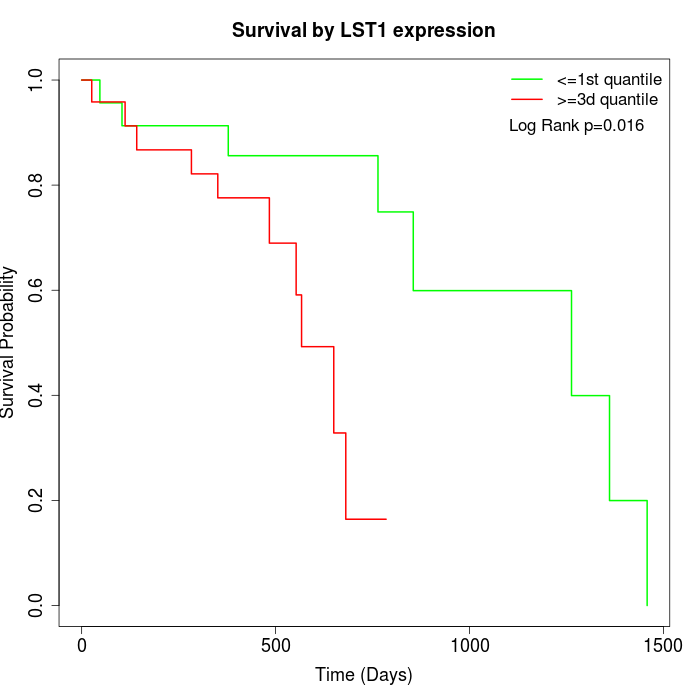 |
| GSE53622 | GSE53624 | TCGA |
Note: Click image to view full size file.
Copy number change of LST1:
| Dataset | Gene | EntrezID | Gain | Loss | Normal | Detail |
|---|---|---|---|---|---|---|
| GSE15526 | LST1 | 7940 | 5 | 1 | 24 | |
| GSE20123 | LST1 | 7940 | 5 | 1 | 24 | |
| GSE43470 | LST1 | 7940 | 6 | 3 | 34 | |
| GSE46452 | LST1 | 7940 | 1 | 10 | 48 | |
| GSE47630 | LST1 | 7940 | 7 | 5 | 28 | |
| GSE54993 | LST1 | 7940 | 2 | 1 | 67 | |
| GSE54994 | LST1 | 7940 | 11 | 4 | 38 | |
| GSE60625 | LST1 | 7940 | 0 | 1 | 10 | |
| GSE74703 | LST1 | 7940 | 6 | 1 | 29 | |
| GSE74704 | LST1 | 7940 | 2 | 0 | 18 | |
| TCGA | LST1 | 7940 | 16 | 16 | 64 |
Total number of gains: 61; Total number of losses: 43; Total Number of normals: 384.
Somatic mutations of LST1:
Generating mutation plots.
Highly correlated genes for LST1:
Showing top 20/227 corelated genes with mean PCC>0.5.
| Gene1 | Gene2 | Mean PCC | Num. Datasets | Num. PCC<0 | Num. PCC>0.5 |
|---|---|---|---|---|---|
| LST1 | C16orf86 | 0.709131 | 3 | 0 | 3 |
| LST1 | FAM78A | 0.693575 | 4 | 0 | 4 |
| LST1 | ABI3 | 0.683823 | 5 | 0 | 4 |
| LST1 | EVI2B | 0.67523 | 8 | 0 | 8 |
| LST1 | PIK3R5 | 0.669127 | 4 | 0 | 3 |
| LST1 | TNR | 0.665886 | 5 | 0 | 4 |
| LST1 | HLA-DRA | 0.664746 | 7 | 0 | 6 |
| LST1 | PRAMEF11 | 0.662498 | 3 | 0 | 3 |
| LST1 | LY86 | 0.660845 | 9 | 0 | 8 |
| LST1 | MYO1G | 0.660526 | 3 | 0 | 3 |
| LST1 | LAT2 | 0.658506 | 5 | 0 | 5 |
| LST1 | ITGB2-AS1 | 0.656581 | 4 | 0 | 4 |
| LST1 | ARHGDIB | 0.649821 | 8 | 0 | 7 |
| LST1 | CD274 | 0.648717 | 3 | 0 | 3 |
| LST1 | DOCK10 | 0.648478 | 7 | 0 | 7 |
| LST1 | MYO1F | 0.64515 | 9 | 0 | 8 |
| LST1 | PTPRC | 0.644114 | 6 | 0 | 6 |
| LST1 | CD74 | 0.644054 | 9 | 0 | 7 |
| LST1 | LINC00924 | 0.643776 | 3 | 0 | 3 |
| LST1 | CD28 | 0.640907 | 4 | 0 | 3 |
For details and further investigation, click here