| Full name: protein tyrosine phosphatase receptor type C | Alias Symbol: LCA|T200|GP180 | ||
| Type: protein-coding gene | Cytoband: 1q31.3-q32.1 | ||
| Entrez ID: 5788 | HGNC ID: HGNC:9666 | Ensembl Gene: ENSG00000081237 | OMIM ID: 151460 |
| Related drugs: EPOETIN BETA, ESTRADIOL, FLUOROURACIL, HYDROCORTISONE, PREDNISONE... [more] | |||
Screen Evidence:
| |||
PTPRC involved pathways:
| KEGG pathway | Description | View |
|---|---|---|
| hsa04660 | T cell receptor signaling pathway | |
| hsa04666 | Fc gamma R-mediated phagocytosis |
Expression of PTPRC:
| Dataset | Gene | EntrezID | Probe | Log2FC | Adj.pValue | Expression |
|---|---|---|---|---|---|---|
| GSE17351 | PTPRC | 5788 | 212587_s_at | 0.3528 | 0.8476 | |
| GSE20347 | PTPRC | 5788 | 212588_at | -0.4201 | 0.2661 | |
| GSE23400 | PTPRC | 5788 | 207238_s_at | 0.1646 | 0.0617 | |
| GSE26886 | PTPRC | 5788 | 212588_at | -2.1116 | 0.0029 | |
| GSE29001 | PTPRC | 5788 | 212588_at | 0.2896 | 0.6346 | |
| GSE38129 | PTPRC | 5788 | 212588_at | -0.3043 | 0.3920 | |
| GSE45670 | PTPRC | 5788 | 212587_s_at | -0.2465 | 0.5936 | |
| GSE53622 | PTPRC | 5788 | 95112 | -0.0674 | 0.6142 | |
| GSE53624 | PTPRC | 5788 | 63259 | -0.2021 | 0.0631 | |
| GSE63941 | PTPRC | 5788 | 207238_s_at | 0.0406 | 0.7325 | |
| GSE77861 | PTPRC | 5788 | 212588_at | -0.2247 | 0.6145 | |
| GSE97050 | PTPRC | 5788 | A_33_P3309526 | 0.2391 | 0.3324 | |
| SRP007169 | PTPRC | 5788 | RNAseq | 0.8567 | 0.1903 | |
| SRP008496 | PTPRC | 5788 | RNAseq | 0.4759 | 0.2037 | |
| SRP064894 | PTPRC | 5788 | RNAseq | 0.3966 | 0.3278 | |
| SRP133303 | PTPRC | 5788 | RNAseq | 0.0448 | 0.8727 | |
| SRP159526 | PTPRC | 5788 | RNAseq | -0.6052 | 0.5331 | |
| SRP193095 | PTPRC | 5788 | RNAseq | 0.2651 | 0.2699 | |
| SRP219564 | PTPRC | 5788 | RNAseq | 0.5707 | 0.3622 | |
| TCGA | PTPRC | 5788 | RNAseq | -0.0024 | 0.9864 |
Upregulated datasets: 0; Downregulated datasets: 1.
Survival by PTPRC expression:
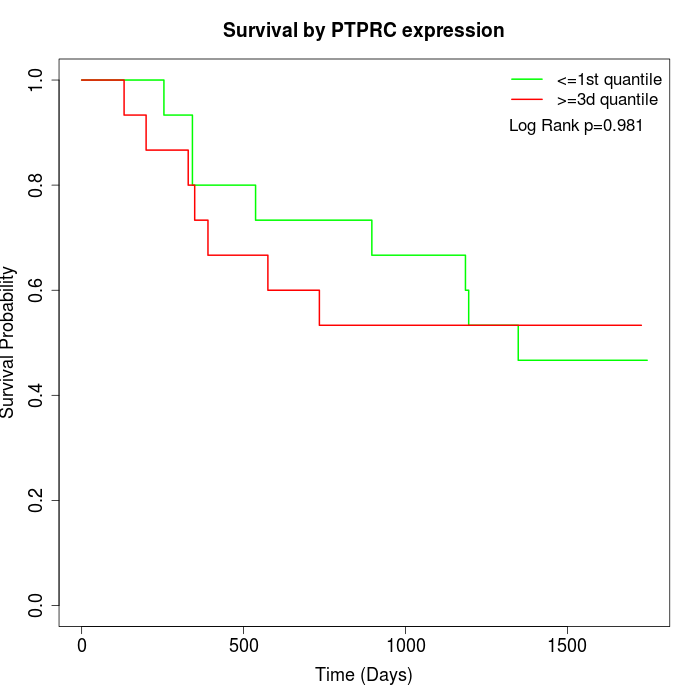 | 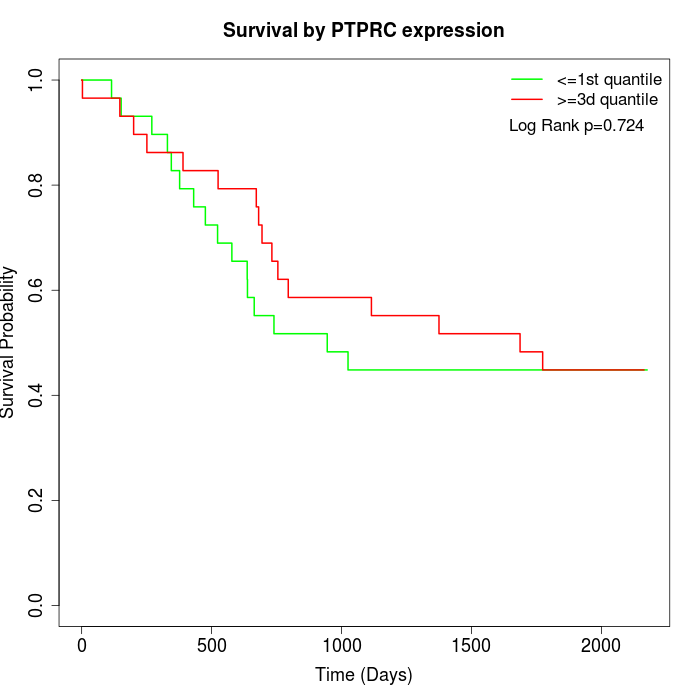 | 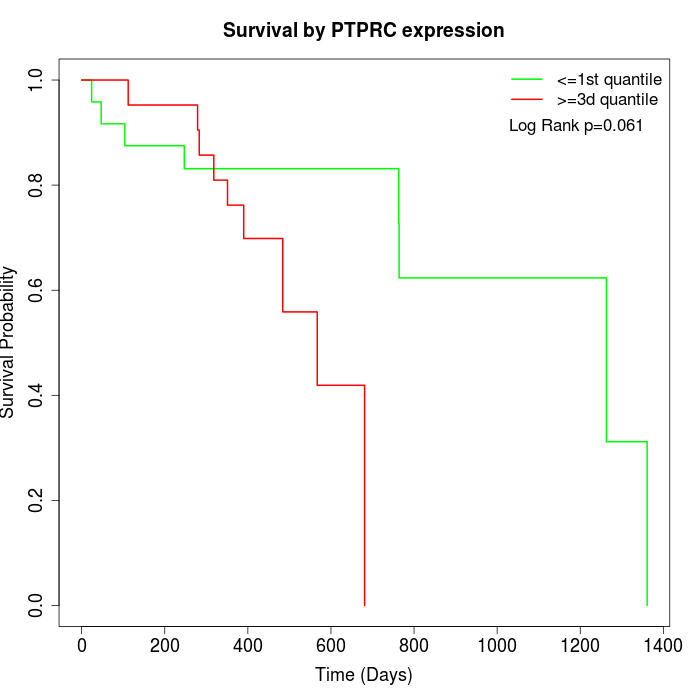 |
| GSE53622 | GSE53624 | TCGA |
Note: Click image to view full size file.
Copy number change of PTPRC:
| Dataset | Gene | EntrezID | Gain | Loss | Normal | Detail |
|---|---|---|---|---|---|---|
| GSE15526 | PTPRC | 5788 | 7 | 0 | 23 | |
| GSE20123 | PTPRC | 5788 | 7 | 0 | 23 | |
| GSE43470 | PTPRC | 5788 | 7 | 0 | 36 | |
| GSE46452 | PTPRC | 5788 | 3 | 1 | 55 | |
| GSE47630 | PTPRC | 5788 | 14 | 0 | 26 | |
| GSE54993 | PTPRC | 5788 | 0 | 6 | 64 | |
| GSE54994 | PTPRC | 5788 | 15 | 0 | 38 | |
| GSE60625 | PTPRC | 5788 | 0 | 0 | 11 | |
| GSE74703 | PTPRC | 5788 | 7 | 0 | 29 | |
| GSE74704 | PTPRC | 5788 | 2 | 0 | 18 | |
| TCGA | PTPRC | 5788 | 43 | 5 | 48 |
Total number of gains: 105; Total number of losses: 12; Total Number of normals: 371.
Somatic mutations of PTPRC:
Generating mutation plots.
Highly correlated genes for PTPRC:
Showing top 20/236 corelated genes with mean PCC>0.5.
| Gene1 | Gene2 | Mean PCC | Num. Datasets | Num. PCC<0 | Num. PCC>0.5 |
|---|---|---|---|---|---|
| PTPRC | EVI2B | 0.828547 | 10 | 0 | 10 |
| PTPRC | PIK3R5 | 0.804892 | 4 | 0 | 4 |
| PTPRC | EVI2A | 0.790135 | 9 | 0 | 9 |
| PTPRC | PARVG | 0.772854 | 4 | 0 | 4 |
| PTPRC | GMFG | 0.754928 | 9 | 0 | 8 |
| PTPRC | ST8SIA4 | 0.753021 | 5 | 0 | 5 |
| PTPRC | DOCK2 | 0.74954 | 10 | 0 | 10 |
| PTPRC | CD28 | 0.749238 | 4 | 0 | 4 |
| PTPRC | CD3D | 0.746084 | 10 | 0 | 10 |
| PTPRC | CD48 | 0.744194 | 11 | 0 | 11 |
| PTPRC | NLRC3 | 0.742535 | 6 | 0 | 6 |
| PTPRC | ARHGDIB | 0.739762 | 9 | 0 | 9 |
| PTPRC | LAPTM5 | 0.738061 | 10 | 0 | 9 |
| PTPRC | IRF8 | 0.736379 | 10 | 0 | 9 |
| PTPRC | CD2 | 0.735355 | 10 | 0 | 10 |
| PTPRC | CD52 | 0.733193 | 10 | 0 | 10 |
| PTPRC | CD84 | 0.732738 | 7 | 0 | 7 |
| PTPRC | CYTIP | 0.73098 | 11 | 0 | 10 |
| PTPRC | HLA-DOA | 0.727491 | 3 | 0 | 3 |
| PTPRC | CSF2RB | 0.720967 | 9 | 0 | 8 |
For details and further investigation, click here