| Full name: LTV1 ribosome biogenesis factor | Alias Symbol: FLJ14909|dJ468K18.4 | ||
| Type: protein-coding gene | Cytoband: 6q24.2 | ||
| Entrez ID: 84946 | HGNC ID: HGNC:21173 | Ensembl Gene: ENSG00000135521 | OMIM ID: |
Screen Evidence:
| |||
Expression of LTV1:
| Dataset | Gene | EntrezID | Probe | Log2FC | Adj.pValue | Expression |
|---|---|---|---|---|---|---|
| GSE17351 | LTV1 | 84946 | 225748_at | 0.4333 | 0.3662 | |
| GSE26886 | LTV1 | 84946 | 225748_at | 0.5095 | 0.0271 | |
| GSE45670 | LTV1 | 84946 | 225748_at | 0.1737 | 0.1615 | |
| GSE53622 | LTV1 | 84946 | 47904 | 0.1685 | 0.0036 | |
| GSE53624 | LTV1 | 84946 | 47904 | 0.1971 | 0.0001 | |
| GSE63941 | LTV1 | 84946 | 225748_at | -0.6094 | 0.2013 | |
| GSE77861 | LTV1 | 84946 | 225748_at | 0.2595 | 0.2383 | |
| GSE97050 | LTV1 | 84946 | A_23_P122624 | 0.0918 | 0.7701 | |
| SRP007169 | LTV1 | 84946 | RNAseq | 0.9700 | 0.0815 | |
| SRP008496 | LTV1 | 84946 | RNAseq | 1.7028 | 0.0006 | |
| SRP064894 | LTV1 | 84946 | RNAseq | 0.0847 | 0.6785 | |
| SRP133303 | LTV1 | 84946 | RNAseq | 0.3848 | 0.0522 | |
| SRP159526 | LTV1 | 84946 | RNAseq | 0.2019 | 0.3572 | |
| SRP193095 | LTV1 | 84946 | RNAseq | 0.0673 | 0.5613 | |
| SRP219564 | LTV1 | 84946 | RNAseq | 0.0759 | 0.8018 | |
| TCGA | LTV1 | 84946 | RNAseq | 0.1161 | 0.0372 |
Upregulated datasets: 1; Downregulated datasets: 0.
Survival by LTV1 expression:
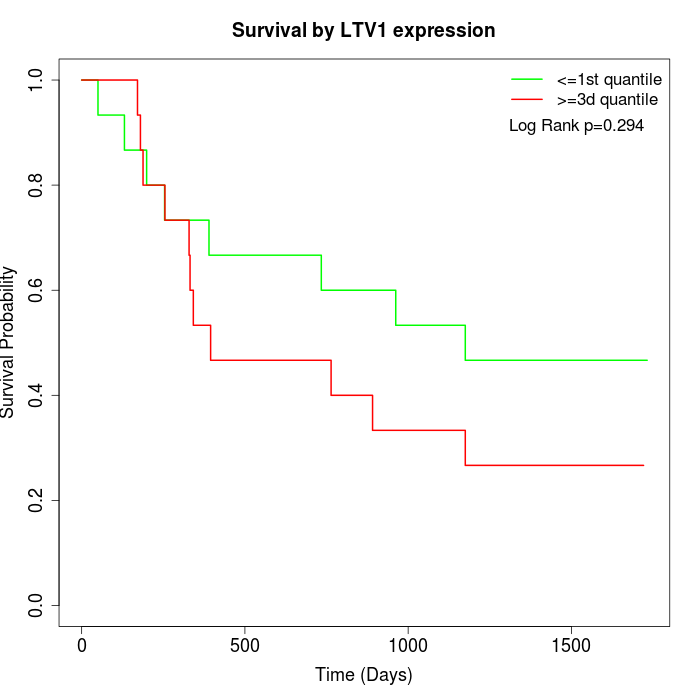 | 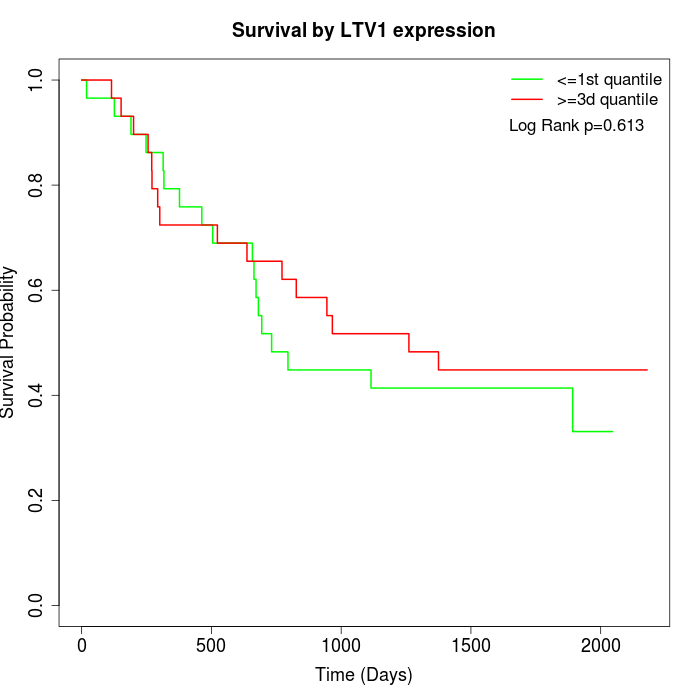 | 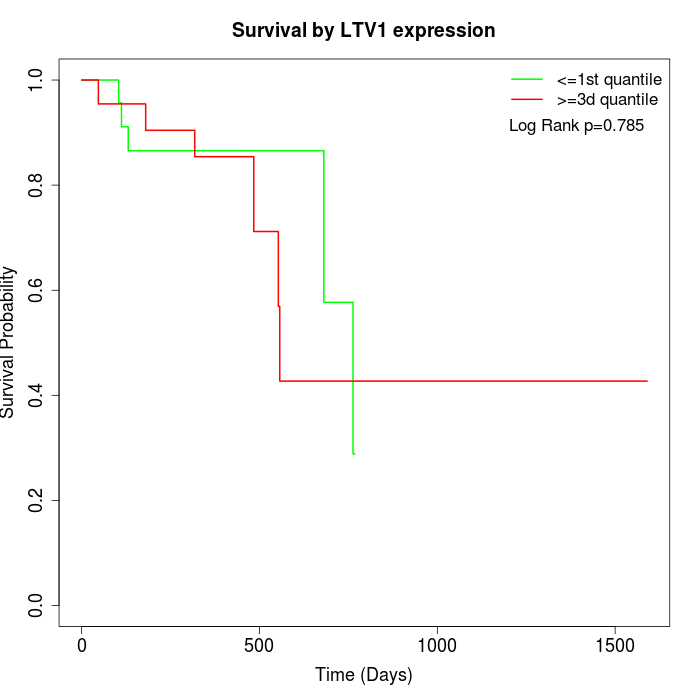 |
| GSE53622 | GSE53624 | TCGA |
Note: Click image to view full size file.
Copy number change of LTV1:
| Dataset | Gene | EntrezID | Gain | Loss | Normal | Detail |
|---|---|---|---|---|---|---|
| GSE15526 | LTV1 | 84946 | 2 | 4 | 24 | |
| GSE20123 | LTV1 | 84946 | 2 | 3 | 25 | |
| GSE43470 | LTV1 | 84946 | 5 | 0 | 38 | |
| GSE46452 | LTV1 | 84946 | 3 | 10 | 46 | |
| GSE47630 | LTV1 | 84946 | 9 | 4 | 27 | |
| GSE54993 | LTV1 | 84946 | 3 | 2 | 65 | |
| GSE54994 | LTV1 | 84946 | 8 | 8 | 37 | |
| GSE60625 | LTV1 | 84946 | 0 | 1 | 10 | |
| GSE74703 | LTV1 | 84946 | 4 | 0 | 32 | |
| GSE74704 | LTV1 | 84946 | 0 | 1 | 19 | |
| TCGA | LTV1 | 84946 | 11 | 19 | 66 |
Total number of gains: 47; Total number of losses: 52; Total Number of normals: 389.
Somatic mutations of LTV1:
Generating mutation plots.
Highly correlated genes for LTV1:
Showing top 20/459 corelated genes with mean PCC>0.5.
| Gene1 | Gene2 | Mean PCC | Num. Datasets | Num. PCC<0 | Num. PCC>0.5 |
|---|---|---|---|---|---|
| LTV1 | RASA2 | 0.809415 | 3 | 0 | 3 |
| LTV1 | ANKRD17 | 0.786305 | 3 | 0 | 3 |
| LTV1 | WDR4 | 0.777567 | 3 | 0 | 3 |
| LTV1 | RBM17 | 0.773657 | 3 | 0 | 3 |
| LTV1 | MRPL9 | 0.768972 | 3 | 0 | 3 |
| LTV1 | TUBGCP3 | 0.768312 | 3 | 0 | 3 |
| LTV1 | LUC7L | 0.761524 | 3 | 0 | 3 |
| LTV1 | XRCC1 | 0.759586 | 3 | 0 | 3 |
| LTV1 | PRPF4B | 0.754729 | 3 | 0 | 3 |
| LTV1 | DYRK2 | 0.75276 | 3 | 0 | 3 |
| LTV1 | C1orf35 | 0.752359 | 3 | 0 | 3 |
| LTV1 | SRSF1 | 0.750917 | 5 | 0 | 4 |
| LTV1 | TMEM135 | 0.747486 | 3 | 0 | 3 |
| LTV1 | ZC3H3 | 0.745745 | 3 | 0 | 3 |
| LTV1 | C12orf73 | 0.737533 | 3 | 0 | 3 |
| LTV1 | HAUS7 | 0.735689 | 3 | 0 | 3 |
| LTV1 | INTS4 | 0.733113 | 3 | 0 | 3 |
| LTV1 | DGKQ | 0.730507 | 3 | 0 | 3 |
| LTV1 | METAP1D | 0.728648 | 3 | 0 | 3 |
| LTV1 | ZNF814 | 0.728227 | 3 | 0 | 3 |
For details and further investigation, click here