| Full name: tubulin gamma complex associated protein 3 | Alias Symbol: GCP3|Spc98p|SPBC98 | ||
| Type: protein-coding gene | Cytoband: 13q34 | ||
| Entrez ID: 10426 | HGNC ID: HGNC:18598 | Ensembl Gene: ENSG00000126216 | OMIM ID: 617818 |
Expression of TUBGCP3:
| Dataset | Gene | EntrezID | Probe | Log2FC | Adj.pValue | Expression |
|---|---|---|---|---|---|---|
| GSE17351 | TUBGCP3 | 10426 | 203690_at | 0.1744 | 0.6837 | |
| GSE20347 | TUBGCP3 | 10426 | 203690_at | 0.5159 | 0.2450 | |
| GSE23400 | TUBGCP3 | 10426 | 203690_at | 0.2414 | 0.0467 | |
| GSE26886 | TUBGCP3 | 10426 | 203690_at | 0.7782 | 0.1003 | |
| GSE29001 | TUBGCP3 | 10426 | 203690_at | 0.5782 | 0.1367 | |
| GSE38129 | TUBGCP3 | 10426 | 203690_at | 0.4053 | 0.1213 | |
| GSE45670 | TUBGCP3 | 10426 | 203690_at | 0.0323 | 0.9018 | |
| GSE53622 | TUBGCP3 | 10426 | 109313 | 0.4655 | 0.0000 | |
| GSE53624 | TUBGCP3 | 10426 | 109313 | 0.4231 | 0.0000 | |
| GSE63941 | TUBGCP3 | 10426 | 203690_at | 0.1396 | 0.7923 | |
| GSE77861 | TUBGCP3 | 10426 | 203690_at | 0.2340 | 0.5596 | |
| GSE97050 | TUBGCP3 | 10426 | A_24_P313096 | 0.0680 | 0.7963 | |
| SRP007169 | TUBGCP3 | 10426 | RNAseq | 0.3411 | 0.3509 | |
| SRP008496 | TUBGCP3 | 10426 | RNAseq | 0.3922 | 0.2503 | |
| SRP064894 | TUBGCP3 | 10426 | RNAseq | 0.2853 | 0.0967 | |
| SRP133303 | TUBGCP3 | 10426 | RNAseq | 0.1899 | 0.1168 | |
| SRP159526 | TUBGCP3 | 10426 | RNAseq | 0.2207 | 0.4341 | |
| SRP193095 | TUBGCP3 | 10426 | RNAseq | 0.2111 | 0.0073 | |
| SRP219564 | TUBGCP3 | 10426 | RNAseq | 0.6712 | 0.0758 | |
| TCGA | TUBGCP3 | 10426 | RNAseq | 0.0968 | 0.1290 |
Upregulated datasets: 0; Downregulated datasets: 0.
Survival by TUBGCP3 expression:
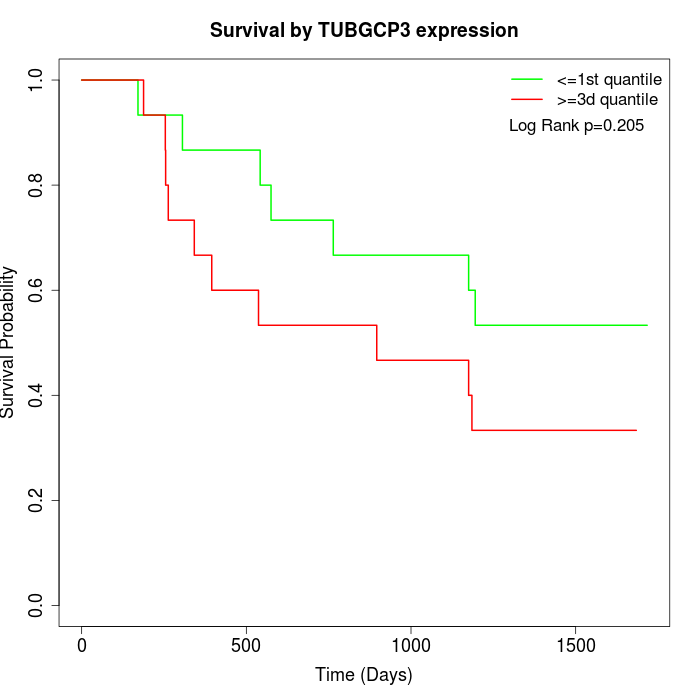 | 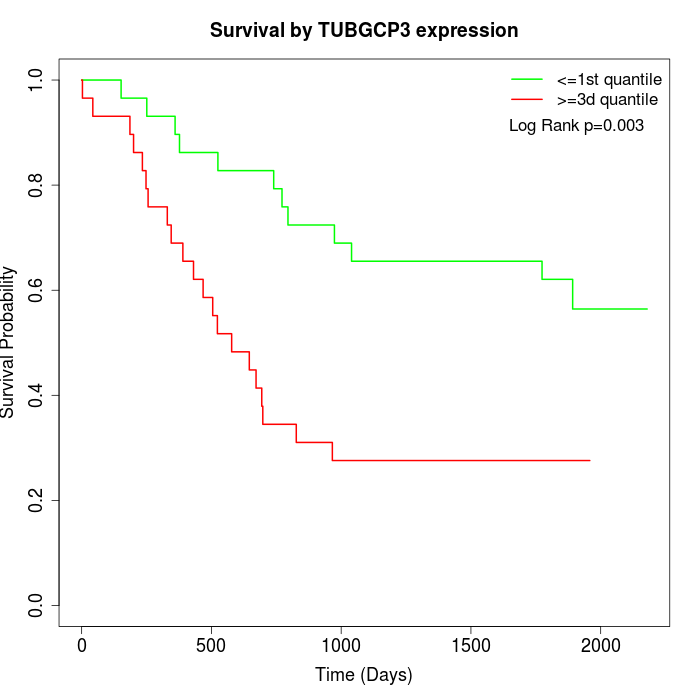 | 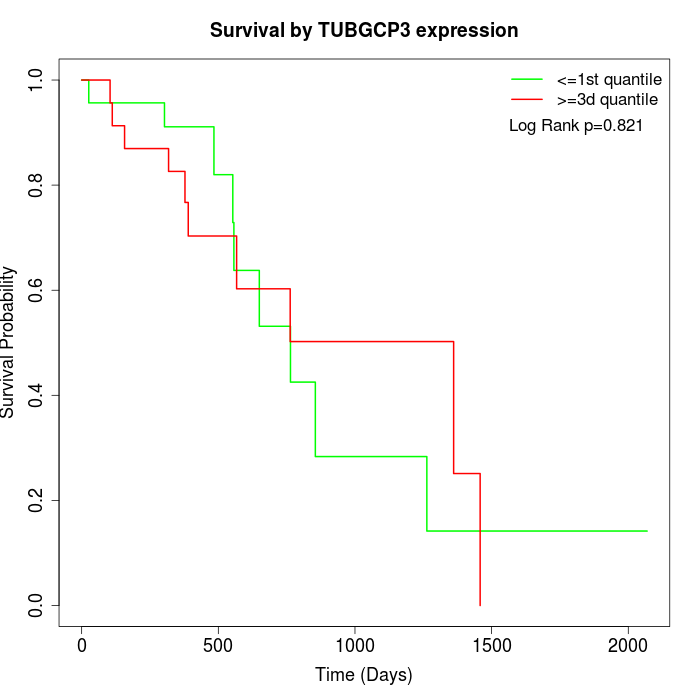 |
| GSE53622 | GSE53624 | TCGA |
Note: Click image to view full size file.
Copy number change of TUBGCP3:
| Dataset | Gene | EntrezID | Gain | Loss | Normal | Detail |
|---|---|---|---|---|---|---|
| GSE15526 | TUBGCP3 | 10426 | 7 | 12 | 11 | |
| GSE20123 | TUBGCP3 | 10426 | 7 | 11 | 12 | |
| GSE43470 | TUBGCP3 | 10426 | 4 | 15 | 24 | |
| GSE46452 | TUBGCP3 | 10426 | 3 | 31 | 25 | |
| GSE47630 | TUBGCP3 | 10426 | 3 | 26 | 11 | |
| GSE54993 | TUBGCP3 | 10426 | 11 | 4 | 55 | |
| GSE54994 | TUBGCP3 | 10426 | 10 | 8 | 35 | |
| GSE60625 | TUBGCP3 | 10426 | 0 | 3 | 8 | |
| GSE74703 | TUBGCP3 | 10426 | 3 | 11 | 22 | |
| GSE74704 | TUBGCP3 | 10426 | 4 | 9 | 7 | |
| TCGA | TUBGCP3 | 10426 | 20 | 32 | 44 |
Total number of gains: 72; Total number of losses: 162; Total Number of normals: 254.
Somatic mutations of TUBGCP3:
Generating mutation plots.
Highly correlated genes for TUBGCP3:
Showing top 20/760 corelated genes with mean PCC>0.5.
| Gene1 | Gene2 | Mean PCC | Num. Datasets | Num. PCC<0 | Num. PCC>0.5 |
|---|---|---|---|---|---|
| TUBGCP3 | ZNF121 | 0.797187 | 3 | 0 | 3 |
| TUBGCP3 | BBS7 | 0.787802 | 3 | 0 | 3 |
| TUBGCP3 | GLRX2 | 0.778494 | 3 | 0 | 3 |
| TUBGCP3 | CCDC59 | 0.769502 | 3 | 0 | 3 |
| TUBGCP3 | MLH1 | 0.76867 | 3 | 0 | 3 |
| TUBGCP3 | LTV1 | 0.768312 | 3 | 0 | 3 |
| TUBGCP3 | C9orf64 | 0.761383 | 3 | 0 | 3 |
| TUBGCP3 | FGD6 | 0.756534 | 3 | 0 | 3 |
| TUBGCP3 | FAM122B | 0.750653 | 3 | 0 | 3 |
| TUBGCP3 | SAT2 | 0.745616 | 3 | 0 | 3 |
| TUBGCP3 | ZFX | 0.744596 | 3 | 0 | 3 |
| TUBGCP3 | ZNF512 | 0.744059 | 4 | 0 | 4 |
| TUBGCP3 | NOLC1 | 0.737092 | 3 | 0 | 3 |
| TUBGCP3 | C8orf76 | 0.73609 | 3 | 0 | 3 |
| TUBGCP3 | ZNF765 | 0.732998 | 3 | 0 | 3 |
| TUBGCP3 | HERPUD2 | 0.730292 | 3 | 0 | 3 |
| TUBGCP3 | WWP1 | 0.730176 | 4 | 0 | 4 |
| TUBGCP3 | LPCAT2 | 0.728429 | 3 | 0 | 3 |
| TUBGCP3 | DYNC1I2 | 0.727608 | 3 | 0 | 3 |
| TUBGCP3 | NUP54 | 0.726998 | 3 | 0 | 3 |
For details and further investigation, click here