| Full name: methyl-CpG binding domain protein 3 | Alias Symbol: | ||
| Type: protein-coding gene | Cytoband: 19p13 | ||
| Entrez ID: 53615 | HGNC ID: HGNC:6918 | Ensembl Gene: | OMIM ID: 603573 |
Screen Evidence:
| |||
Expression of MBD3:
| Dataset | Gene | EntrezID | Probe | Log2FC | Adj.pValue | Expression |
|---|---|---|---|---|---|---|
| GSE17351 | MBD3 | 53615 | 41160_at | 0.6413 | 0.2418 | |
| GSE20347 | MBD3 | 53615 | 41160_at | 0.2035 | 0.0834 | |
| GSE23400 | MBD3 | 53615 | 41160_at | 0.1854 | 0.0021 | |
| GSE26886 | MBD3 | 53615 | 41160_at | 0.6400 | 0.0002 | |
| GSE29001 | MBD3 | 53615 | 41160_at | -0.1669 | 0.3592 | |
| GSE38129 | MBD3 | 53615 | 41160_at | 0.1977 | 0.0493 | |
| GSE45670 | MBD3 | 53615 | 41160_at | 0.4979 | 0.0007 | |
| GSE53622 | MBD3 | 53615 | 34146 | -0.1627 | 0.0016 | |
| GSE53624 | MBD3 | 53615 | 34146 | 0.0834 | 0.0981 | |
| GSE63941 | MBD3 | 53615 | 41160_at | -0.4728 | 0.0910 | |
| GSE77861 | MBD3 | 53615 | 41160_at | 0.3259 | 0.0508 | |
| GSE97050 | MBD3 | 53615 | A_23_P50839 | -0.2658 | 0.3363 | |
| SRP007169 | MBD3 | 53615 | RNAseq | 1.7333 | 0.0032 | |
| SRP008496 | MBD3 | 53615 | RNAseq | 1.5433 | 0.0004 | |
| SRP064894 | MBD3 | 53615 | RNAseq | 1.0970 | 0.0018 | |
| SRP133303 | MBD3 | 53615 | RNAseq | 0.1498 | 0.3792 | |
| SRP159526 | MBD3 | 53615 | RNAseq | 0.4093 | 0.1515 | |
| SRP193095 | MBD3 | 53615 | RNAseq | 0.1730 | 0.1310 | |
| SRP219564 | MBD3 | 53615 | RNAseq | 0.3830 | 0.3586 | |
| TCGA | MBD3 | 53615 | RNAseq | -0.0001 | 0.9991 |
Upregulated datasets: 3; Downregulated datasets: 0.
Survival by MBD3 expression:
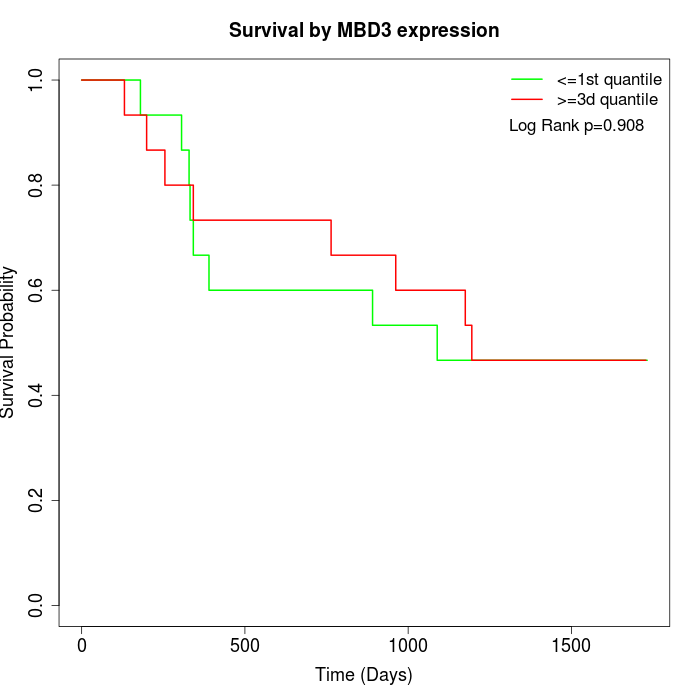 | 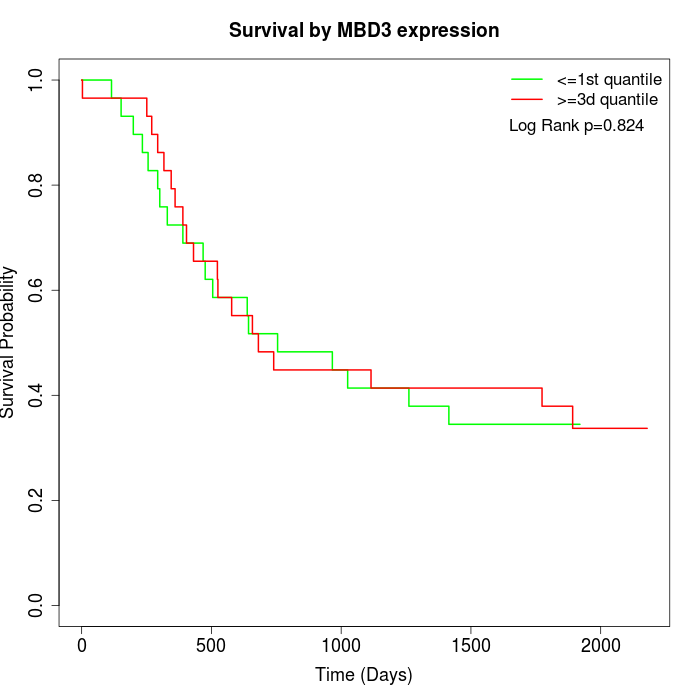 | 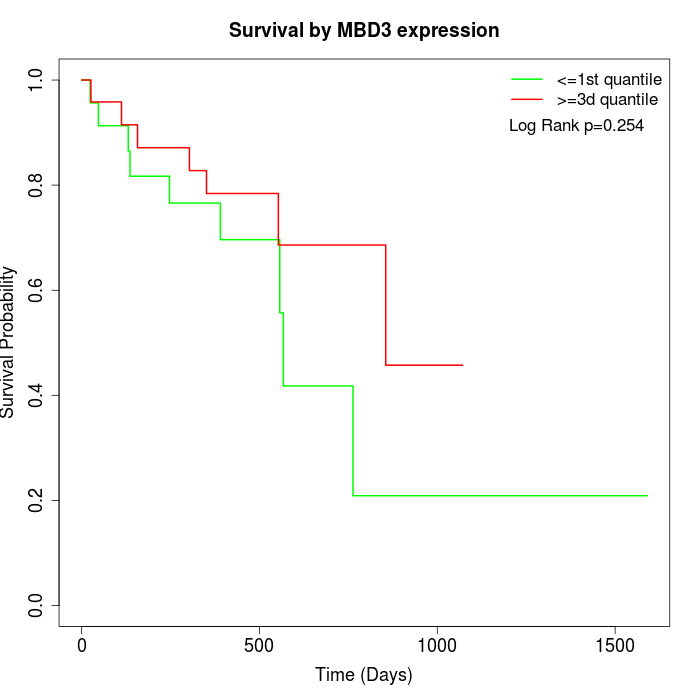 |
| GSE53622 | GSE53624 | TCGA |
Note: Click image to view full size file.
Copy number change of MBD3:
| Dataset | Gene | EntrezID | Gain | Loss | Normal | Detail |
|---|---|---|---|---|---|---|
| GSE15526 | MBD3 | 53615 | 4 | 6 | 20 | |
| GSE20123 | MBD3 | 53615 | 4 | 5 | 21 | |
| GSE43470 | MBD3 | 53615 | 1 | 11 | 31 | |
| GSE46452 | MBD3 | 53615 | 47 | 1 | 11 | |
| GSE47630 | MBD3 | 53615 | 5 | 7 | 28 | |
| GSE54993 | MBD3 | 53615 | 16 | 3 | 51 | |
| GSE54994 | MBD3 | 53615 | 8 | 15 | 30 | |
| GSE60625 | MBD3 | 53615 | 9 | 0 | 2 | |
| GSE74703 | MBD3 | 53615 | 1 | 8 | 27 | |
| GSE74704 | MBD3 | 53615 | 3 | 3 | 14 | |
| TCGA | MBD3 | 53615 | 6 | 25 | 65 |
Total number of gains: 104; Total number of losses: 84; Total Number of normals: 300.
Somatic mutations of MBD3:
Generating mutation plots.
Highly correlated genes for MBD3:
Showing top 20/583 corelated genes with mean PCC>0.5.
| Gene1 | Gene2 | Mean PCC | Num. Datasets | Num. PCC<0 | Num. PCC>0.5 |
|---|---|---|---|---|---|
| MBD3 | HIP1 | 0.75491 | 3 | 0 | 3 |
| MBD3 | SLC39A3 | 0.743285 | 4 | 0 | 4 |
| MBD3 | SCARA3 | 0.73026 | 3 | 0 | 3 |
| MBD3 | DNTTIP1 | 0.719263 | 3 | 0 | 3 |
| MBD3 | ATF7IP | 0.716899 | 3 | 0 | 3 |
| MBD3 | OAF | 0.70707 | 4 | 0 | 4 |
| MBD3 | COL4A2 | 0.706264 | 3 | 0 | 3 |
| MBD3 | NINJ1 | 0.703366 | 3 | 0 | 3 |
| MBD3 | RILPL1 | 0.698099 | 4 | 0 | 3 |
| MBD3 | NOM1 | 0.696918 | 3 | 0 | 3 |
| MBD3 | GLIS2 | 0.696267 | 4 | 0 | 4 |
| MBD3 | NFIC | 0.694206 | 4 | 0 | 4 |
| MBD3 | CCDC124 | 0.69205 | 3 | 0 | 3 |
| MBD3 | ALKBH6 | 0.690959 | 5 | 0 | 4 |
| MBD3 | ZNF628 | 0.690831 | 3 | 0 | 3 |
| MBD3 | MPG | 0.690623 | 3 | 0 | 3 |
| MBD3 | B3GNT9 | 0.690399 | 4 | 0 | 4 |
| MBD3 | INO80E | 0.689997 | 4 | 0 | 4 |
| MBD3 | KRTCAP2 | 0.687154 | 5 | 0 | 4 |
| MBD3 | IGFBP4 | 0.686154 | 4 | 0 | 3 |
For details and further investigation, click here