| Full name: scavenger receptor class A member 3 | Alias Symbol: CSR1|CSR|MSLR1|APC7|MSRL1 | ||
| Type: protein-coding gene | Cytoband: 8p21.1 | ||
| Entrez ID: 51435 | HGNC ID: HGNC:19000 | Ensembl Gene: ENSG00000168077 | OMIM ID: 602728 |
Expression of SCARA3:
| Dataset | Gene | EntrezID | Probe | Log2FC | Adj.pValue | Expression |
|---|---|---|---|---|---|---|
| GSE17351 | SCARA3 | 51435 | 219416_at | -0.2405 | 0.7399 | |
| GSE20347 | SCARA3 | 51435 | 219416_at | 0.1738 | 0.2313 | |
| GSE23400 | SCARA3 | 51435 | 219416_at | -0.0309 | 0.6574 | |
| GSE26886 | SCARA3 | 51435 | 219416_at | 0.5399 | 0.0098 | |
| GSE29001 | SCARA3 | 51435 | 219416_at | -0.0146 | 0.9532 | |
| GSE38129 | SCARA3 | 51435 | 219416_at | -0.1261 | 0.3658 | |
| GSE45670 | SCARA3 | 51435 | 219416_at | -0.2991 | 0.0103 | |
| GSE53622 | SCARA3 | 51435 | 72714 | -0.7273 | 0.0000 | |
| GSE53624 | SCARA3 | 51435 | 112133 | -0.3783 | 0.0001 | |
| GSE63941 | SCARA3 | 51435 | 219416_at | 0.0394 | 0.9549 | |
| GSE77861 | SCARA3 | 51435 | 219416_at | 0.2881 | 0.2199 | |
| GSE97050 | SCARA3 | 51435 | A_33_P3352019 | -0.1997 | 0.5385 | |
| SRP007169 | SCARA3 | 51435 | RNAseq | 0.5343 | 0.4603 | |
| SRP008496 | SCARA3 | 51435 | RNAseq | 0.5692 | 0.2319 | |
| SRP064894 | SCARA3 | 51435 | RNAseq | 0.1191 | 0.7279 | |
| SRP133303 | SCARA3 | 51435 | RNAseq | -1.2496 | 0.0000 | |
| SRP159526 | SCARA3 | 51435 | RNAseq | -0.0693 | 0.7731 | |
| SRP193095 | SCARA3 | 51435 | RNAseq | 0.4539 | 0.0381 | |
| SRP219564 | SCARA3 | 51435 | RNAseq | -1.0504 | 0.2569 | |
| TCGA | SCARA3 | 51435 | RNAseq | -0.0841 | 0.4761 |
Upregulated datasets: 0; Downregulated datasets: 1.
Survival by SCARA3 expression:
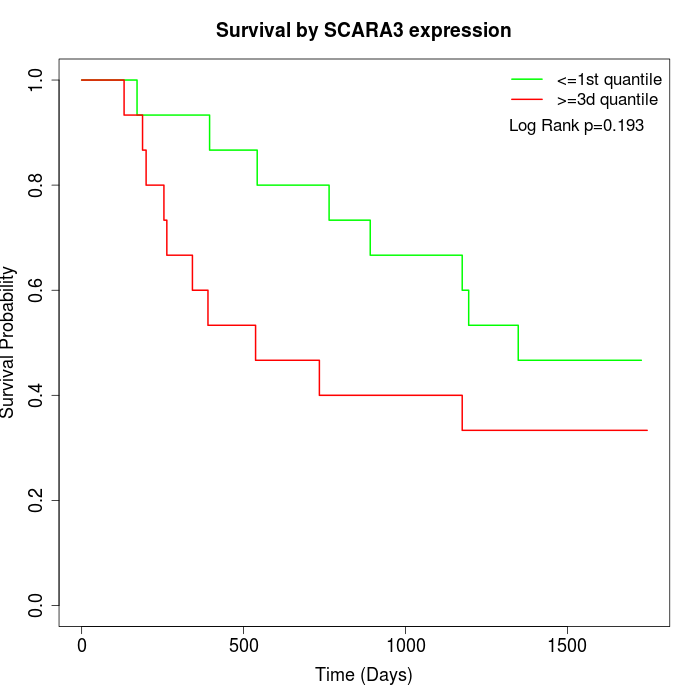 | 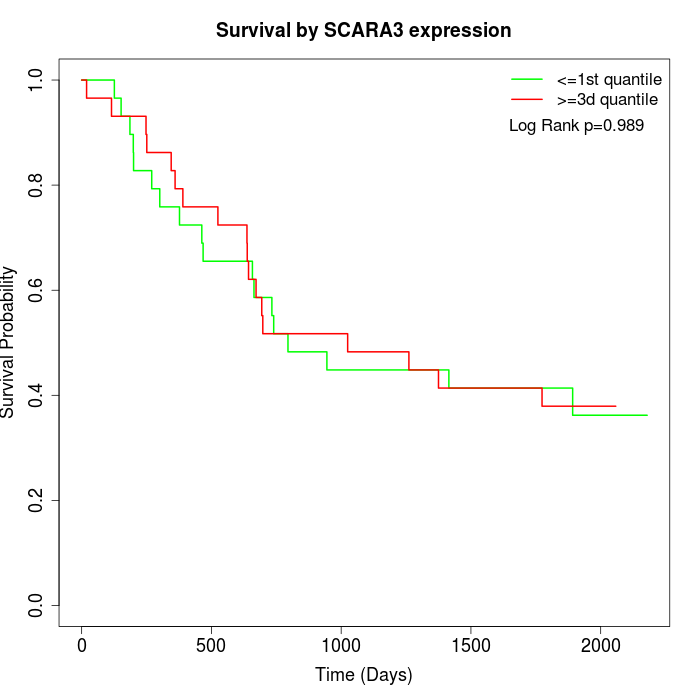 |  |
| GSE53622 | GSE53624 | TCGA |
Note: Click image to view full size file.
Copy number change of SCARA3:
| Dataset | Gene | EntrezID | Gain | Loss | Normal | Detail |
|---|---|---|---|---|---|---|
| GSE15526 | SCARA3 | 51435 | 6 | 10 | 14 | |
| GSE20123 | SCARA3 | 51435 | 6 | 10 | 14 | |
| GSE43470 | SCARA3 | 51435 | 4 | 7 | 32 | |
| GSE46452 | SCARA3 | 51435 | 13 | 13 | 33 | |
| GSE47630 | SCARA3 | 51435 | 10 | 8 | 22 | |
| GSE54993 | SCARA3 | 51435 | 2 | 15 | 53 | |
| GSE54994 | SCARA3 | 51435 | 10 | 15 | 28 | |
| GSE60625 | SCARA3 | 51435 | 3 | 0 | 8 | |
| GSE74703 | SCARA3 | 51435 | 4 | 6 | 26 | |
| GSE74704 | SCARA3 | 51435 | 4 | 7 | 9 | |
| TCGA | SCARA3 | 51435 | 16 | 43 | 37 |
Total number of gains: 78; Total number of losses: 134; Total Number of normals: 276.
Somatic mutations of SCARA3:
Generating mutation plots.
Highly correlated genes for SCARA3:
Showing top 20/567 corelated genes with mean PCC>0.5.
| Gene1 | Gene2 | Mean PCC | Num. Datasets | Num. PCC<0 | Num. PCC>0.5 |
|---|---|---|---|---|---|
| SCARA3 | CXXC1 | 0.766259 | 3 | 0 | 3 |
| SCARA3 | DOK6 | 0.765029 | 3 | 0 | 3 |
| SCARA3 | SPOCK1 | 0.752572 | 3 | 0 | 3 |
| SCARA3 | MBD3 | 0.73026 | 3 | 0 | 3 |
| SCARA3 | RAD23A | 0.711417 | 3 | 0 | 3 |
| SCARA3 | SLC38A10 | 0.710146 | 5 | 0 | 4 |
| SCARA3 | TMEM60 | 0.709709 | 3 | 0 | 3 |
| SCARA3 | R3HDM2 | 0.707727 | 3 | 0 | 3 |
| SCARA3 | GHDC | 0.707406 | 4 | 0 | 4 |
| SCARA3 | TP53I13 | 0.707116 | 3 | 0 | 3 |
| SCARA3 | UNC45A | 0.706246 | 4 | 0 | 3 |
| SCARA3 | HMGN4 | 0.704855 | 3 | 0 | 3 |
| SCARA3 | EIF5A2 | 0.704559 | 3 | 0 | 3 |
| SCARA3 | HPCAL1 | 0.701509 | 3 | 0 | 3 |
| SCARA3 | BTBD2 | 0.699506 | 3 | 0 | 3 |
| SCARA3 | TRRAP | 0.697206 | 3 | 0 | 3 |
| SCARA3 | TMEM187 | 0.697186 | 3 | 0 | 3 |
| SCARA3 | TSHZ3 | 0.696336 | 3 | 0 | 3 |
| SCARA3 | FGD3 | 0.694118 | 3 | 0 | 3 |
| SCARA3 | ORAI3 | 0.693164 | 7 | 0 | 5 |
For details and further investigation, click here