| Full name: pleckstrin homology domain containing O1 | Alias Symbol: CKIP-1|OC120 | ||
| Type: protein-coding gene | Cytoband: 1q21.2 | ||
| Entrez ID: 51177 | HGNC ID: HGNC:24310 | Ensembl Gene: ENSG00000023902 | OMIM ID: 608335 |
Expression of PLEKHO1:
| Dataset | Gene | EntrezID | Probe | Log2FC | Adj.pValue | Expression |
|---|---|---|---|---|---|---|
| GSE17351 | PLEKHO1 | 51177 | 218223_s_at | -0.3296 | 0.8089 | |
| GSE20347 | PLEKHO1 | 51177 | 218223_s_at | 0.6039 | 0.0026 | |
| GSE23400 | PLEKHO1 | 51177 | 218223_s_at | -0.0861 | 0.6449 | |
| GSE26886 | PLEKHO1 | 51177 | 218223_s_at | 1.1613 | 0.0002 | |
| GSE29001 | PLEKHO1 | 51177 | 218223_s_at | 0.4429 | 0.1069 | |
| GSE38129 | PLEKHO1 | 51177 | 218223_s_at | 0.0596 | 0.8869 | |
| GSE45670 | PLEKHO1 | 51177 | 218223_s_at | -0.6471 | 0.0191 | |
| GSE53622 | PLEKHO1 | 51177 | 24652 | -0.0244 | 0.8758 | |
| GSE53624 | PLEKHO1 | 51177 | 24652 | 0.4044 | 0.0000 | |
| GSE63941 | PLEKHO1 | 51177 | 218223_s_at | -2.0726 | 0.0055 | |
| GSE77861 | PLEKHO1 | 51177 | 218223_s_at | 0.5340 | 0.0097 | |
| GSE97050 | PLEKHO1 | 51177 | A_33_P3330039 | -0.4600 | 0.2467 | |
| SRP007169 | PLEKHO1 | 51177 | RNAseq | 2.5061 | 0.0001 | |
| SRP008496 | PLEKHO1 | 51177 | RNAseq | 2.0848 | 0.0000 | |
| SRP064894 | PLEKHO1 | 51177 | RNAseq | 0.0569 | 0.8417 | |
| SRP133303 | PLEKHO1 | 51177 | RNAseq | 0.1497 | 0.6745 | |
| SRP159526 | PLEKHO1 | 51177 | RNAseq | 0.2107 | 0.3837 | |
| SRP193095 | PLEKHO1 | 51177 | RNAseq | 0.9904 | 0.0000 | |
| SRP219564 | PLEKHO1 | 51177 | RNAseq | -0.4294 | 0.5970 | |
| TCGA | PLEKHO1 | 51177 | RNAseq | -0.0050 | 0.9604 |
Upregulated datasets: 3; Downregulated datasets: 1.
Survival by PLEKHO1 expression:
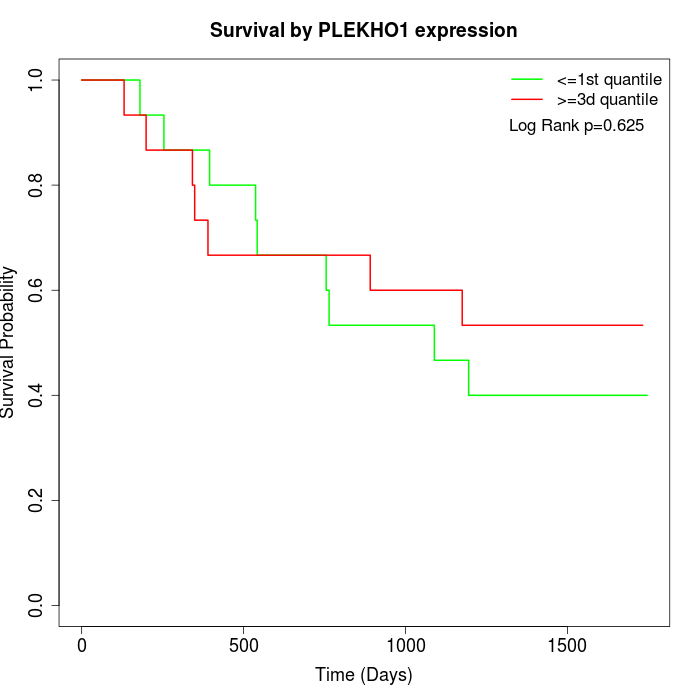 |  | 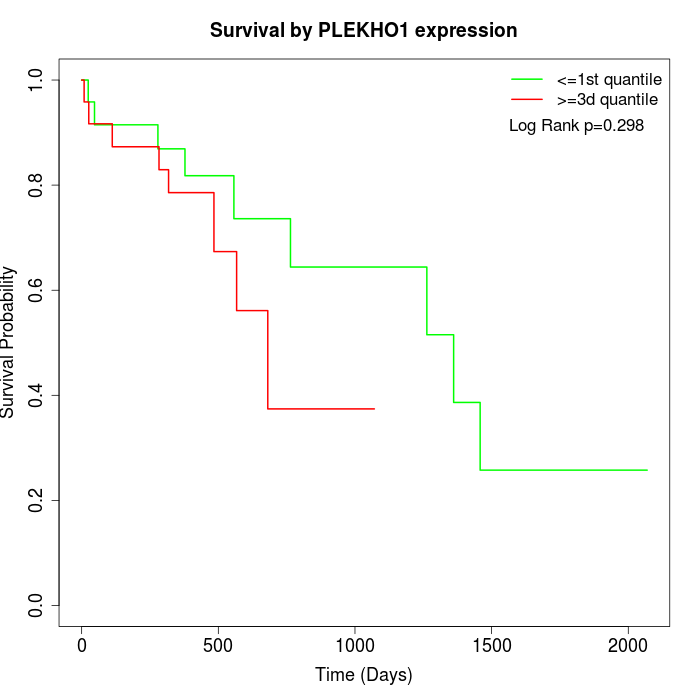 |
| GSE53622 | GSE53624 | TCGA |
Note: Click image to view full size file.
Copy number change of PLEKHO1:
| Dataset | Gene | EntrezID | Gain | Loss | Normal | Detail |
|---|---|---|---|---|---|---|
| GSE15526 | PLEKHO1 | 51177 | 15 | 0 | 15 | |
| GSE20123 | PLEKHO1 | 51177 | 15 | 0 | 15 | |
| GSE43470 | PLEKHO1 | 51177 | 6 | 1 | 36 | |
| GSE46452 | PLEKHO1 | 51177 | 2 | 1 | 56 | |
| GSE47630 | PLEKHO1 | 51177 | 14 | 0 | 26 | |
| GSE54993 | PLEKHO1 | 51177 | 0 | 3 | 67 | |
| GSE54994 | PLEKHO1 | 51177 | 15 | 0 | 38 | |
| GSE60625 | PLEKHO1 | 51177 | 0 | 0 | 11 | |
| GSE74703 | PLEKHO1 | 51177 | 6 | 1 | 29 | |
| GSE74704 | PLEKHO1 | 51177 | 7 | 0 | 13 | |
| TCGA | PLEKHO1 | 51177 | 37 | 3 | 56 |
Total number of gains: 117; Total number of losses: 9; Total Number of normals: 362.
Somatic mutations of PLEKHO1:
Generating mutation plots.
Highly correlated genes for PLEKHO1:
Showing top 20/1471 corelated genes with mean PCC>0.5.
| Gene1 | Gene2 | Mean PCC | Num. Datasets | Num. PCC<0 | Num. PCC>0.5 |
|---|---|---|---|---|---|
| PLEKHO1 | ZEB1 | 0.78139 | 3 | 0 | 3 |
| PLEKHO1 | MCAM | 0.770011 | 10 | 0 | 9 |
| PLEKHO1 | C11orf96 | 0.764491 | 5 | 0 | 4 |
| PLEKHO1 | FERMT2 | 0.763552 | 13 | 0 | 13 |
| PLEKHO1 | PKIG | 0.763143 | 12 | 0 | 11 |
| PLEKHO1 | KCNJ8 | 0.762241 | 11 | 0 | 11 |
| PLEKHO1 | TNFSF12 | 0.757655 | 3 | 0 | 3 |
| PLEKHO1 | ANXA6 | 0.757391 | 13 | 0 | 12 |
| PLEKHO1 | FBN1 | 0.755718 | 10 | 0 | 10 |
| PLEKHO1 | WDR81 | 0.751149 | 3 | 0 | 3 |
| PLEKHO1 | LAMA4 | 0.747024 | 12 | 0 | 11 |
| PLEKHO1 | AKT3 | 0.743648 | 11 | 0 | 10 |
| PLEKHO1 | TGFB1I1 | 0.735327 | 12 | 0 | 11 |
| PLEKHO1 | ALKBH6 | 0.731037 | 3 | 0 | 3 |
| PLEKHO1 | SLC39A13 | 0.730487 | 7 | 0 | 7 |
| PLEKHO1 | ILK | 0.729523 | 7 | 0 | 7 |
| PLEKHO1 | KRTCAP2 | 0.729292 | 3 | 0 | 3 |
| PLEKHO1 | CORO6 | 0.728577 | 4 | 0 | 4 |
| PLEKHO1 | ALDH1B1 | 0.72836 | 9 | 0 | 8 |
| PLEKHO1 | IL33 | 0.728285 | 4 | 0 | 4 |
For details and further investigation, click here