| Full name: GLI pathogenesis related 2 | Alias Symbol: GAPR-1 | ||
| Type: protein-coding gene | Cytoband: 9p13.3 | ||
| Entrez ID: 152007 | HGNC ID: HGNC:18007 | Ensembl Gene: ENSG00000122694 | OMIM ID: 607141 |
Expression of GLIPR2:
| Dataset | Gene | EntrezID | Probe | Log2FC | Adj.pValue | Expression |
|---|---|---|---|---|---|---|
| GSE17351 | GLIPR2 | 152007 | 225602_at | 0.0845 | 0.9463 | |
| GSE26886 | GLIPR2 | 152007 | 225602_at | 1.0652 | 0.0069 | |
| GSE45670 | GLIPR2 | 152007 | 225602_at | -1.0374 | 0.0021 | |
| GSE53622 | GLIPR2 | 152007 | 122672 | -0.5464 | 0.0001 | |
| GSE53624 | GLIPR2 | 152007 | 76983 | -0.0490 | 0.5508 | |
| GSE63941 | GLIPR2 | 152007 | 225602_at | -3.7528 | 0.0004 | |
| GSE77861 | GLIPR2 | 152007 | 225602_at | 0.0933 | 0.6729 | |
| GSE97050 | GLIPR2 | 152007 | A_33_P3369760 | -0.5398 | 0.1939 | |
| SRP007169 | GLIPR2 | 152007 | RNAseq | 2.8775 | 0.0008 | |
| SRP064894 | GLIPR2 | 152007 | RNAseq | 0.5231 | 0.1045 | |
| SRP133303 | GLIPR2 | 152007 | RNAseq | -0.0296 | 0.9131 | |
| SRP159526 | GLIPR2 | 152007 | RNAseq | -0.2788 | 0.2131 | |
| SRP193095 | GLIPR2 | 152007 | RNAseq | 0.5234 | 0.0367 | |
| SRP219564 | GLIPR2 | 152007 | RNAseq | 0.0075 | 0.9925 | |
| TCGA | GLIPR2 | 152007 | RNAseq | -0.2589 | 0.0167 |
Upregulated datasets: 2; Downregulated datasets: 2.
Survival by GLIPR2 expression:
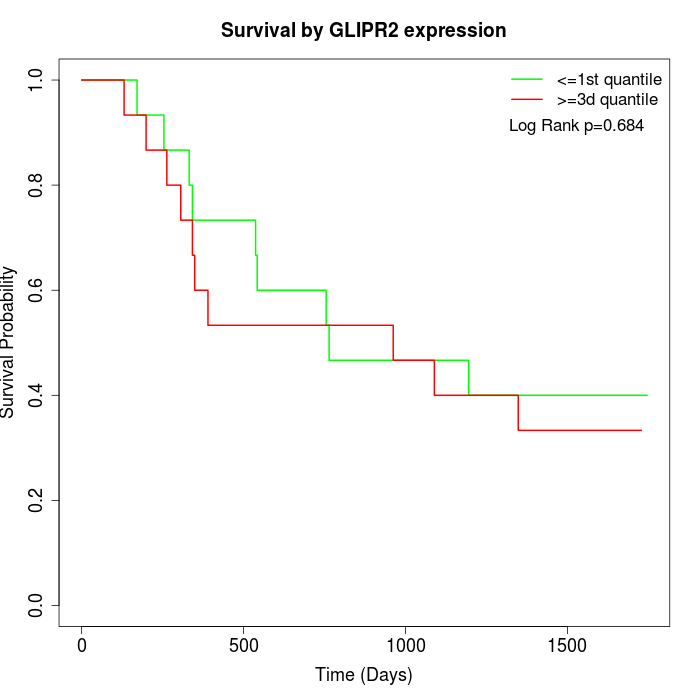 | 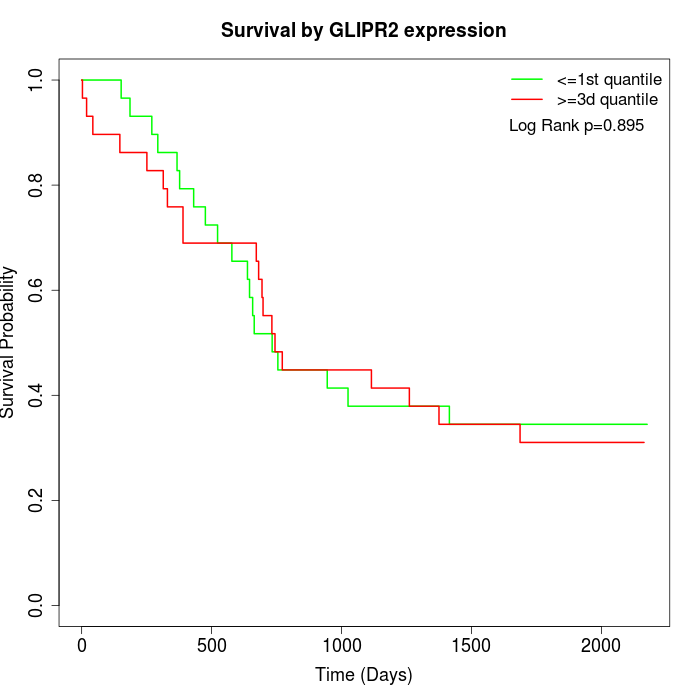 | 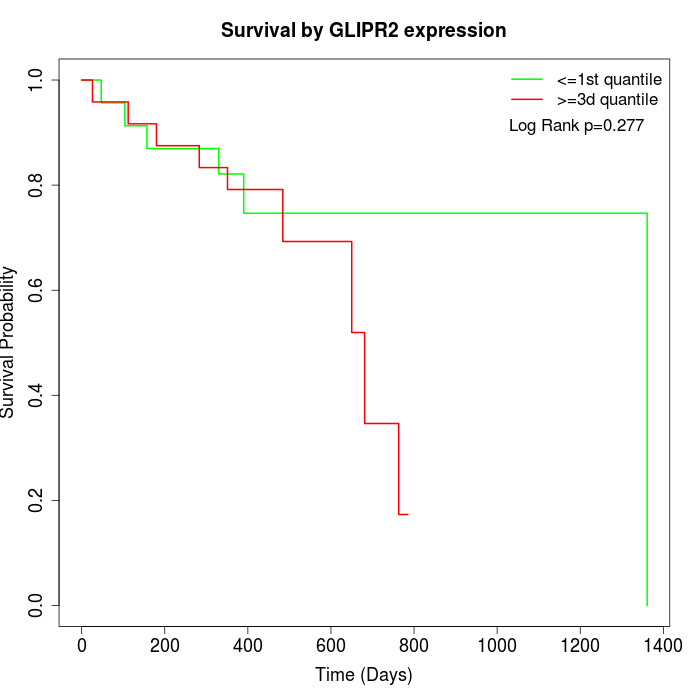 |
| GSE53622 | GSE53624 | TCGA |
Note: Click image to view full size file.
Copy number change of GLIPR2:
| Dataset | Gene | EntrezID | Gain | Loss | Normal | Detail |
|---|---|---|---|---|---|---|
| GSE15526 | GLIPR2 | 152007 | 3 | 12 | 15 | |
| GSE20123 | GLIPR2 | 152007 | 3 | 12 | 15 | |
| GSE43470 | GLIPR2 | 152007 | 3 | 10 | 30 | |
| GSE46452 | GLIPR2 | 152007 | 6 | 15 | 38 | |
| GSE47630 | GLIPR2 | 152007 | 1 | 20 | 19 | |
| GSE54993 | GLIPR2 | 152007 | 6 | 0 | 64 | |
| GSE54994 | GLIPR2 | 152007 | 5 | 12 | 36 | |
| GSE60625 | GLIPR2 | 152007 | 0 | 0 | 11 | |
| GSE74703 | GLIPR2 | 152007 | 2 | 7 | 27 | |
| GSE74704 | GLIPR2 | 152007 | 0 | 10 | 10 | |
| TCGA | GLIPR2 | 152007 | 15 | 44 | 37 |
Total number of gains: 44; Total number of losses: 142; Total Number of normals: 302.
Somatic mutations of GLIPR2:
Generating mutation plots.
Highly correlated genes for GLIPR2:
Showing top 20/1033 corelated genes with mean PCC>0.5.
| Gene1 | Gene2 | Mean PCC | Num. Datasets | Num. PCC<0 | Num. PCC>0.5 |
|---|---|---|---|---|---|
| GLIPR2 | MCAM | 0.802875 | 5 | 0 | 5 |
| GLIPR2 | DIXDC1 | 0.777254 | 6 | 0 | 6 |
| GLIPR2 | FN1 | 0.776737 | 4 | 0 | 4 |
| GLIPR2 | ENO2 | 0.754622 | 3 | 0 | 3 |
| GLIPR2 | DAB2 | 0.74661 | 8 | 0 | 8 |
| GLIPR2 | RBM24 | 0.740972 | 5 | 0 | 5 |
| GLIPR2 | PKIG | 0.738723 | 7 | 0 | 7 |
| GLIPR2 | PMP22 | 0.737263 | 8 | 0 | 7 |
| GLIPR2 | KLF11 | 0.731048 | 3 | 0 | 3 |
| GLIPR2 | GNG2 | 0.729624 | 5 | 0 | 5 |
| GLIPR2 | HEG1 | 0.728608 | 3 | 0 | 3 |
| GLIPR2 | LIX1L | 0.727257 | 7 | 0 | 6 |
| GLIPR2 | ANXA6 | 0.724836 | 8 | 0 | 7 |
| GLIPR2 | PLEKHO1 | 0.722547 | 8 | 0 | 7 |
| GLIPR2 | RFTN1 | 0.721442 | 8 | 0 | 7 |
| GLIPR2 | C1orf54 | 0.716256 | 7 | 0 | 7 |
| GLIPR2 | KANK2 | 0.715405 | 7 | 0 | 7 |
| GLIPR2 | TGFBR2 | 0.715265 | 5 | 0 | 5 |
| GLIPR2 | MAN1A1 | 0.713003 | 6 | 0 | 6 |
| GLIPR2 | TBC1D2B | 0.711177 | 4 | 0 | 4 |
For details and further investigation, click here