| Full name: phospholipase B domain containing 2 | Alias Symbol: p76 | ||
| Type: protein-coding gene | Cytoband: 12q24.13 | ||
| Entrez ID: 196463 | HGNC ID: HGNC:27283 | Ensembl Gene: ENSG00000151176 | OMIM ID: |
Expression of PLBD2:
| Dataset | Gene | EntrezID | Probe | Log2FC | Adj.pValue | Expression |
|---|---|---|---|---|---|---|
| GSE17351 | PLBD2 | 196463 | 227853_at | 0.7690 | 0.0494 | |
| GSE26886 | PLBD2 | 196463 | 227853_at | 1.7579 | 0.0000 | |
| GSE45670 | PLBD2 | 196463 | 227853_at | 0.4867 | 0.0057 | |
| GSE53622 | PLBD2 | 196463 | 55202 | 0.7417 | 0.0000 | |
| GSE53624 | PLBD2 | 196463 | 55202 | 0.4885 | 0.0000 | |
| GSE63941 | PLBD2 | 196463 | 227853_at | -1.8039 | 0.0001 | |
| GSE77861 | PLBD2 | 196463 | 227853_at | 0.8368 | 0.0005 | |
| GSE97050 | PLBD2 | 196463 | A_23_P10911 | 0.2290 | 0.5492 | |
| SRP007169 | PLBD2 | 196463 | RNAseq | 1.7110 | 0.0001 | |
| SRP008496 | PLBD2 | 196463 | RNAseq | 1.7208 | 0.0000 | |
| SRP064894 | PLBD2 | 196463 | RNAseq | 1.1787 | 0.0000 | |
| SRP133303 | PLBD2 | 196463 | RNAseq | 0.9455 | 0.0000 | |
| SRP159526 | PLBD2 | 196463 | RNAseq | 0.9110 | 0.0000 | |
| SRP193095 | PLBD2 | 196463 | RNAseq | 1.0088 | 0.0000 | |
| SRP219564 | PLBD2 | 196463 | RNAseq | 0.9182 | 0.0132 | |
| TCGA | PLBD2 | 196463 | RNAseq | 0.0780 | 0.1300 |
Upregulated datasets: 5; Downregulated datasets: 1.
Survival by PLBD2 expression:
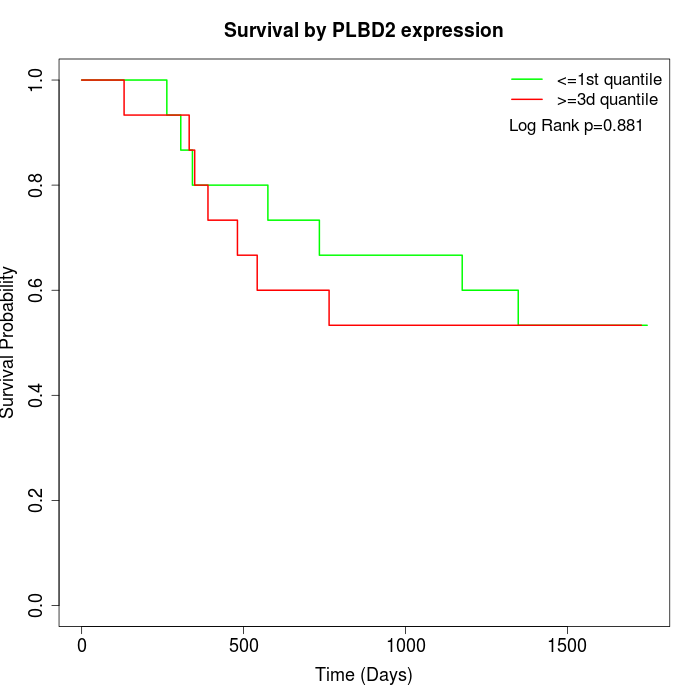 | 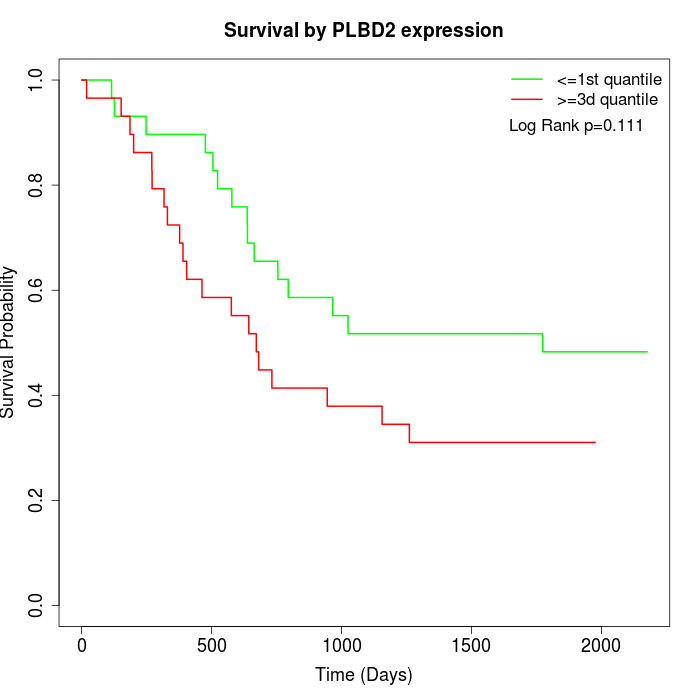 | 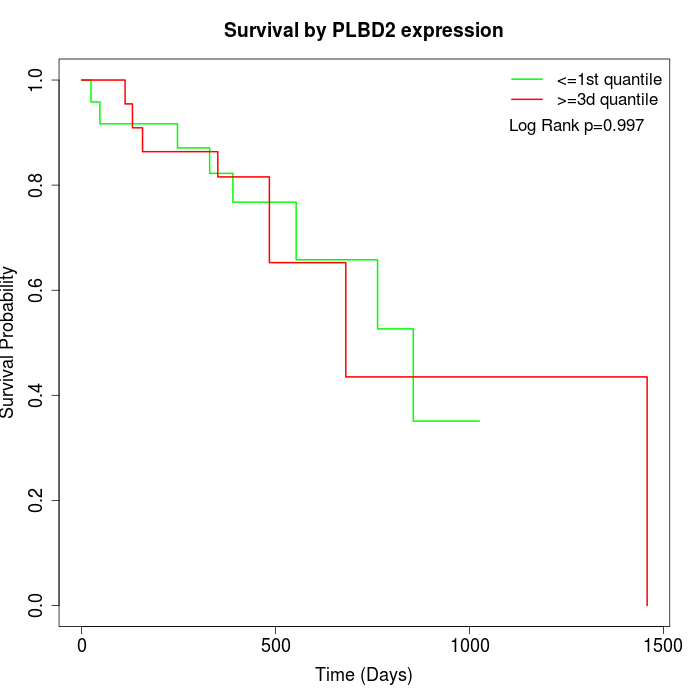 |
| GSE53622 | GSE53624 | TCGA |
Note: Click image to view full size file.
Copy number change of PLBD2:
| Dataset | Gene | EntrezID | Gain | Loss | Normal | Detail |
|---|---|---|---|---|---|---|
| GSE15526 | PLBD2 | 196463 | 4 | 3 | 23 | |
| GSE20123 | PLBD2 | 196463 | 4 | 3 | 23 | |
| GSE43470 | PLBD2 | 196463 | 2 | 0 | 41 | |
| GSE46452 | PLBD2 | 196463 | 9 | 1 | 49 | |
| GSE47630 | PLBD2 | 196463 | 9 | 3 | 28 | |
| GSE54993 | PLBD2 | 196463 | 0 | 5 | 65 | |
| GSE54994 | PLBD2 | 196463 | 4 | 2 | 47 | |
| GSE60625 | PLBD2 | 196463 | 0 | 0 | 11 | |
| GSE74703 | PLBD2 | 196463 | 2 | 0 | 34 | |
| GSE74704 | PLBD2 | 196463 | 2 | 2 | 16 | |
| TCGA | PLBD2 | 196463 | 22 | 11 | 63 |
Total number of gains: 58; Total number of losses: 30; Total Number of normals: 400.
Somatic mutations of PLBD2:
Generating mutation plots.
Highly correlated genes for PLBD2:
Showing top 20/1059 corelated genes with mean PCC>0.5.
| Gene1 | Gene2 | Mean PCC | Num. Datasets | Num. PCC<0 | Num. PCC>0.5 |
|---|---|---|---|---|---|
| PLBD2 | FBN1 | 0.833126 | 3 | 0 | 3 |
| PLBD2 | RHOQ | 0.787438 | 3 | 0 | 3 |
| PLBD2 | MCAM | 0.785903 | 3 | 0 | 3 |
| PLBD2 | DVL2 | 0.785202 | 3 | 0 | 3 |
| PLBD2 | DPYSL2 | 0.782624 | 3 | 0 | 3 |
| PLBD2 | CRISPLD2 | 0.766565 | 3 | 0 | 3 |
| PLBD2 | ALKBH6 | 0.766558 | 3 | 0 | 3 |
| PLBD2 | VPS13C | 0.764471 | 3 | 0 | 3 |
| PLBD2 | COLGALT1 | 0.764091 | 6 | 0 | 5 |
| PLBD2 | RFTN1 | 0.763821 | 3 | 0 | 3 |
| PLBD2 | TMEM184B | 0.744581 | 6 | 0 | 6 |
| PLBD2 | PRKG1 | 0.743742 | 3 | 0 | 3 |
| PLBD2 | PLOD1 | 0.740775 | 7 | 0 | 7 |
| PLBD2 | KRTCAP2 | 0.739668 | 3 | 0 | 3 |
| PLBD2 | BGN | 0.736005 | 8 | 0 | 8 |
| PLBD2 | ANO6 | 0.734775 | 3 | 0 | 3 |
| PLBD2 | PLA2G15 | 0.734714 | 5 | 0 | 5 |
| PLBD2 | PKIG | 0.732122 | 3 | 0 | 3 |
| PLBD2 | HOMER3 | 0.731463 | 8 | 0 | 8 |
| PLBD2 | DPYSL3 | 0.730232 | 3 | 0 | 3 |
For details and further investigation, click here