| Full name: melanocyte inducing transcription factor | Alias Symbol: MI|bHLHe32 | ||
| Type: protein-coding gene | Cytoband: 3p13 | ||
| Entrez ID: 4286 | HGNC ID: HGNC:7105 | Ensembl Gene: ENSG00000187098 | OMIM ID: 156845 |
| Related drugs: PLX-4720, SELUMETINIB... [more] | |||
MITF involved pathways:
| KEGG pathway | Description | View |
|---|---|---|
| hsa04916 | Melanogenesis |
Expression of MITF:
| Dataset | Gene | EntrezID | Probe | Log2FC | Adj.pValue | Expression |
|---|---|---|---|---|---|---|
| GSE17351 | MITF | 4286 | 207233_s_at | -0.7985 | 0.3532 | |
| GSE20347 | MITF | 4286 | 207233_s_at | -0.3087 | 0.0910 | |
| GSE23400 | MITF | 4286 | 207233_s_at | -0.3593 | 0.0007 | |
| GSE26886 | MITF | 4286 | 226066_at | -0.4174 | 0.2873 | |
| GSE29001 | MITF | 4286 | 207233_s_at | -0.5247 | 0.0952 | |
| GSE38129 | MITF | 4286 | 207233_s_at | -0.6784 | 0.0022 | |
| GSE45670 | MITF | 4286 | 226066_at | -2.0313 | 0.0000 | |
| GSE53622 | MITF | 4286 | 12864 | -0.4895 | 0.0004 | |
| GSE53624 | MITF | 4286 | 73959 | -0.4685 | 0.0000 | |
| GSE63941 | MITF | 4286 | 207233_s_at | -1.6104 | 0.1311 | |
| GSE77861 | MITF | 4286 | 207233_s_at | -0.2347 | 0.1167 | |
| GSE97050 | MITF | 4286 | A_33_P3338733 | -0.9513 | 0.1887 | |
| SRP007169 | MITF | 4286 | RNAseq | 0.9102 | 0.1328 | |
| SRP008496 | MITF | 4286 | RNAseq | 1.4432 | 0.0017 | |
| SRP064894 | MITF | 4286 | RNAseq | 0.1799 | 0.6233 | |
| SRP133303 | MITF | 4286 | RNAseq | 0.3316 | 0.3031 | |
| SRP159526 | MITF | 4286 | RNAseq | -0.1802 | 0.5767 | |
| SRP193095 | MITF | 4286 | RNAseq | -0.5649 | 0.0237 | |
| SRP219564 | MITF | 4286 | RNAseq | -0.4225 | 0.6213 | |
| TCGA | MITF | 4286 | RNAseq | -0.8367 | 0.0000 |
Upregulated datasets: 1; Downregulated datasets: 1.
Survival by MITF expression:
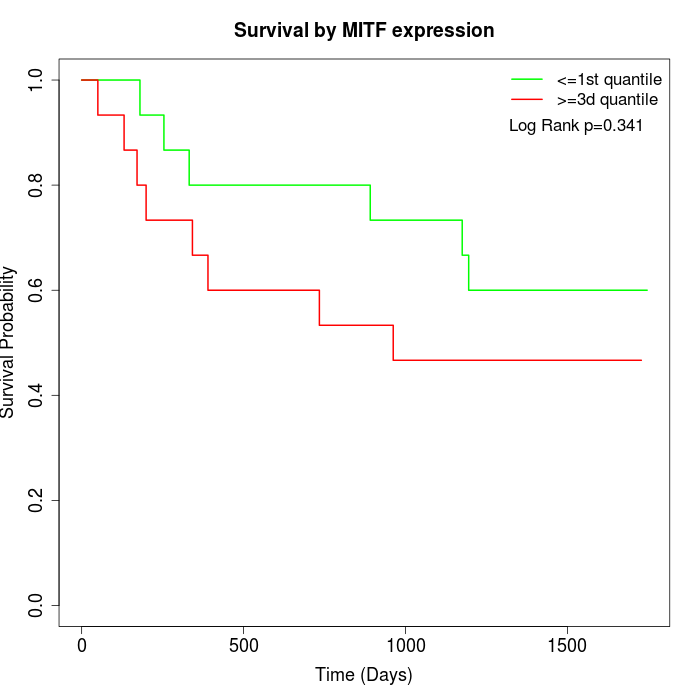 | 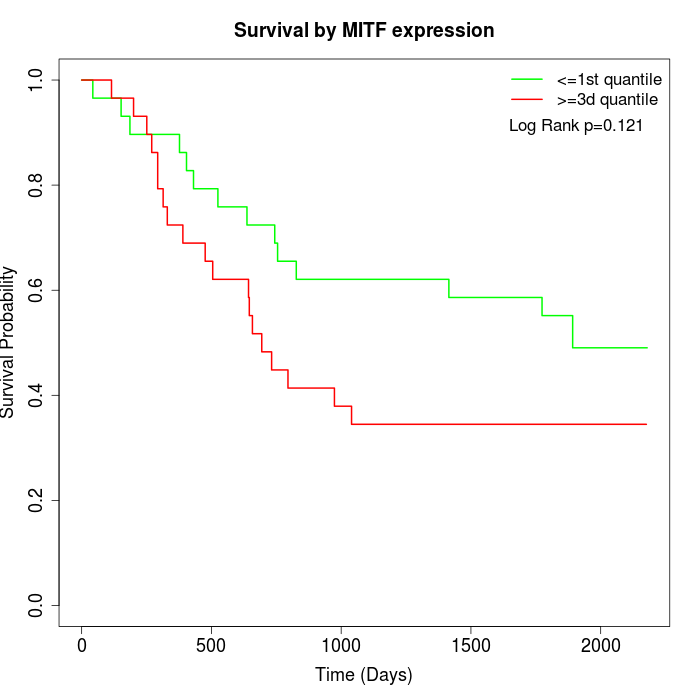 | 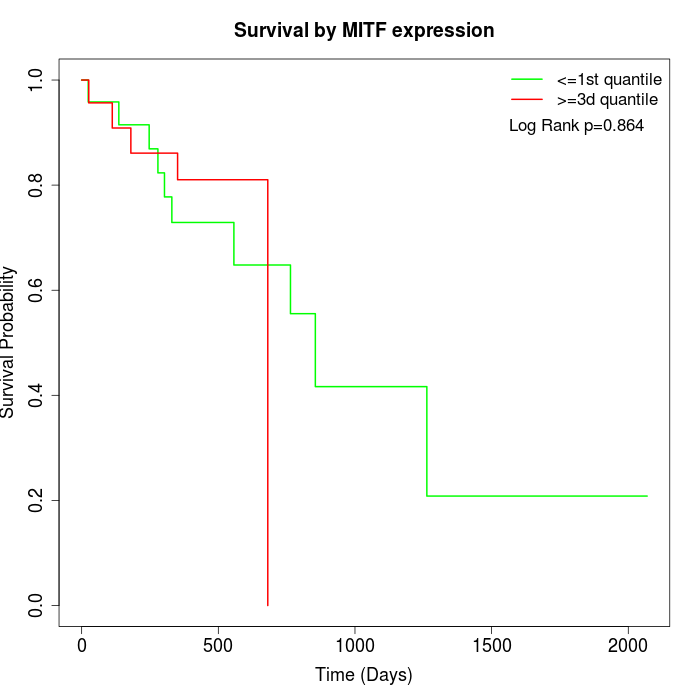 |
| GSE53622 | GSE53624 | TCGA |
Note: Click image to view full size file.
Copy number change of MITF:
| Dataset | Gene | EntrezID | Gain | Loss | Normal | Detail |
|---|---|---|---|---|---|---|
| GSE15526 | MITF | 4286 | 1 | 19 | 10 | |
| GSE20123 | MITF | 4286 | 1 | 19 | 10 | |
| GSE43470 | MITF | 4286 | 0 | 20 | 23 | |
| GSE46452 | MITF | 4286 | 2 | 17 | 40 | |
| GSE47630 | MITF | 4286 | 1 | 23 | 16 | |
| GSE54993 | MITF | 4286 | 5 | 3 | 62 | |
| GSE54994 | MITF | 4286 | 1 | 33 | 19 | |
| GSE60625 | MITF | 4286 | 3 | 1 | 7 | |
| GSE74703 | MITF | 4286 | 0 | 16 | 20 | |
| GSE74704 | MITF | 4286 | 1 | 13 | 6 | |
| TCGA | MITF | 4286 | 0 | 79 | 17 |
Total number of gains: 15; Total number of losses: 243; Total Number of normals: 230.
Somatic mutations of MITF:
Generating mutation plots.
Highly correlated genes for MITF:
Showing top 20/811 corelated genes with mean PCC>0.5.
| Gene1 | Gene2 | Mean PCC | Num. Datasets | Num. PCC<0 | Num. PCC>0.5 |
|---|---|---|---|---|---|
| MITF | SLC8A1 | 0.793721 | 4 | 0 | 4 |
| MITF | CCDC136 | 0.790431 | 3 | 0 | 3 |
| MITF | RNF150 | 0.785144 | 5 | 0 | 5 |
| MITF | SLC25A4 | 0.78254 | 6 | 0 | 6 |
| MITF | LRCH1 | 0.781287 | 4 | 0 | 4 |
| MITF | STARD9 | 0.778068 | 4 | 0 | 4 |
| MITF | ADAMTSL1 | 0.773097 | 5 | 0 | 4 |
| MITF | FXYD1 | 0.77193 | 6 | 0 | 6 |
| MITF | EPM2A | 0.764674 | 6 | 0 | 5 |
| MITF | LINC00702 | 0.763216 | 3 | 0 | 3 |
| MITF | MIR100HG | 0.758793 | 4 | 0 | 4 |
| MITF | DAAM2 | 0.753078 | 8 | 0 | 7 |
| MITF | CREBRF | 0.752228 | 4 | 0 | 4 |
| MITF | LINC01279 | 0.750267 | 3 | 0 | 3 |
| MITF | SMAD9 | 0.748439 | 6 | 0 | 5 |
| MITF | RAI2 | 0.743516 | 9 | 0 | 8 |
| MITF | PPP1R14A | 0.74248 | 5 | 0 | 4 |
| MITF | HSPB7 | 0.738875 | 8 | 0 | 8 |
| MITF | TMOD1 | 0.738295 | 6 | 0 | 5 |
| MITF | ADARB1 | 0.733616 | 7 | 0 | 7 |
For details and further investigation, click here