| Full name: metal regulatory transcription factor 1 | Alias Symbol: | ||
| Type: protein-coding gene | Cytoband: 1p34.3 | ||
| Entrez ID: 4520 | HGNC ID: HGNC:7428 | Ensembl Gene: ENSG00000188786 | OMIM ID: 600172 |
Screen Evidence:
| |||
Expression of MTF1:
| Dataset | Gene | EntrezID | Probe | Log2FC | Adj.pValue | Expression |
|---|---|---|---|---|---|---|
| GSE17351 | MTF1 | 4520 | 205322_s_at | 0.0061 | 0.9943 | |
| GSE20347 | MTF1 | 4520 | 205323_s_at | -0.5181 | 0.0000 | |
| GSE23400 | MTF1 | 4520 | 205323_s_at | -0.4936 | 0.0000 | |
| GSE26886 | MTF1 | 4520 | 227150_at | -2.1728 | 0.0000 | |
| GSE29001 | MTF1 | 4520 | 205323_s_at | -0.4973 | 0.0489 | |
| GSE38129 | MTF1 | 4520 | 205322_s_at | -0.6558 | 0.0002 | |
| GSE45670 | MTF1 | 4520 | 227150_at | -0.2408 | 0.2309 | |
| GSE53622 | MTF1 | 4520 | 38936 | -1.1196 | 0.0000 | |
| GSE53624 | MTF1 | 4520 | 38936 | -1.2021 | 0.0000 | |
| GSE63941 | MTF1 | 4520 | 227150_at | -0.6388 | 0.1459 | |
| GSE77861 | MTF1 | 4520 | 205323_s_at | -0.1798 | 0.4000 | |
| GSE97050 | MTF1 | 4520 | A_33_P3294237 | -0.5088 | 0.1189 | |
| SRP007169 | MTF1 | 4520 | RNAseq | -1.3546 | 0.0062 | |
| SRP008496 | MTF1 | 4520 | RNAseq | -1.5450 | 0.0000 | |
| SRP064894 | MTF1 | 4520 | RNAseq | -0.9272 | 0.0000 | |
| SRP133303 | MTF1 | 4520 | RNAseq | -0.7345 | 0.0000 | |
| SRP159526 | MTF1 | 4520 | RNAseq | -1.1326 | 0.0007 | |
| SRP193095 | MTF1 | 4520 | RNAseq | -0.6014 | 0.0000 | |
| SRP219564 | MTF1 | 4520 | RNAseq | -0.5705 | 0.2956 | |
| TCGA | MTF1 | 4520 | RNAseq | -0.0848 | 0.1751 |
Upregulated datasets: 0; Downregulated datasets: 6.
Survival by MTF1 expression:
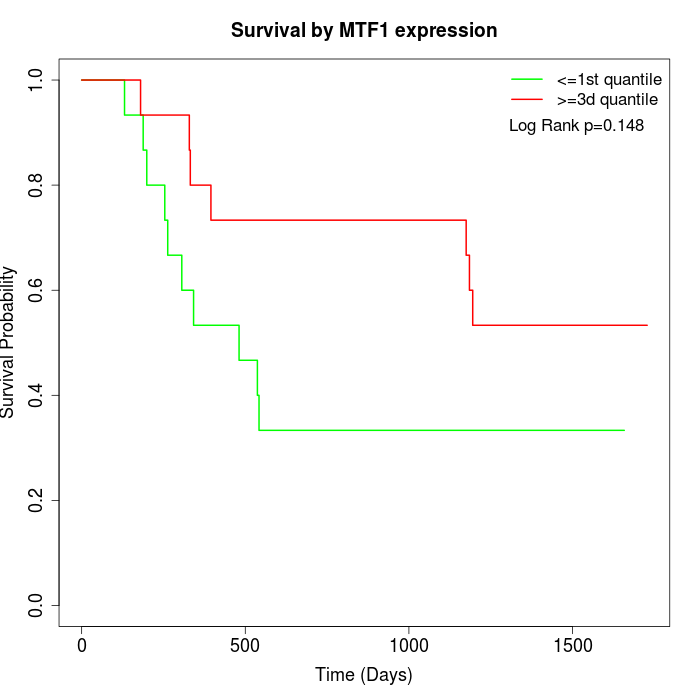 | 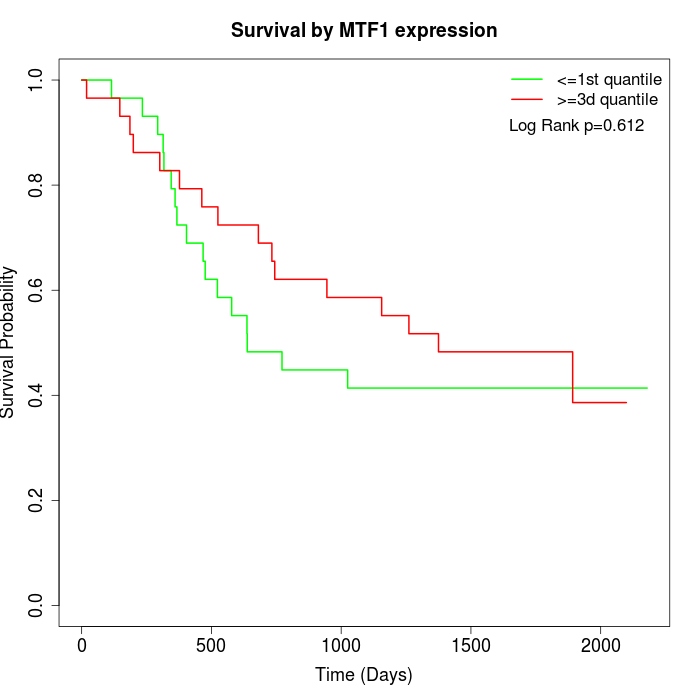 | 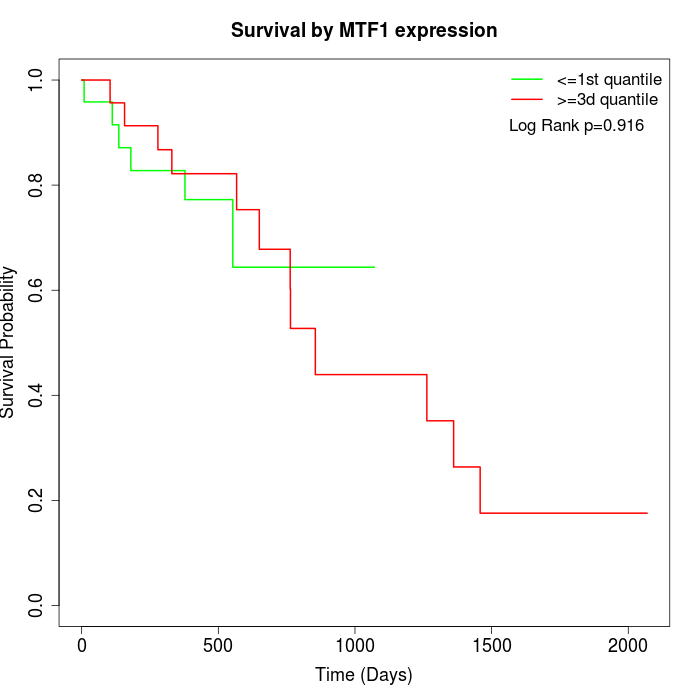 |
| GSE53622 | GSE53624 | TCGA |
Note: Click image to view full size file.
Copy number change of MTF1:
| Dataset | Gene | EntrezID | Gain | Loss | Normal | Detail |
|---|---|---|---|---|---|---|
| GSE15526 | MTF1 | 4520 | 2 | 4 | 24 | |
| GSE20123 | MTF1 | 4520 | 2 | 3 | 25 | |
| GSE43470 | MTF1 | 4520 | 7 | 3 | 33 | |
| GSE46452 | MTF1 | 4520 | 4 | 1 | 54 | |
| GSE47630 | MTF1 | 4520 | 8 | 3 | 29 | |
| GSE54993 | MTF1 | 4520 | 1 | 1 | 68 | |
| GSE54994 | MTF1 | 4520 | 12 | 2 | 39 | |
| GSE60625 | MTF1 | 4520 | 0 | 0 | 11 | |
| GSE74703 | MTF1 | 4520 | 6 | 2 | 28 | |
| GSE74704 | MTF1 | 4520 | 1 | 0 | 19 | |
| TCGA | MTF1 | 4520 | 12 | 17 | 67 |
Total number of gains: 55; Total number of losses: 36; Total Number of normals: 397.
Somatic mutations of MTF1:
Generating mutation plots.
Highly correlated genes for MTF1:
Showing top 20/1499 corelated genes with mean PCC>0.5.
| Gene1 | Gene2 | Mean PCC | Num. Datasets | Num. PCC<0 | Num. PCC>0.5 |
|---|---|---|---|---|---|
| MTF1 | ZNF416 | 0.815561 | 4 | 0 | 4 |
| MTF1 | DDI2 | 0.813471 | 3 | 0 | 3 |
| MTF1 | HDHD2 | 0.795975 | 3 | 0 | 3 |
| MTF1 | PGM2 | 0.790104 | 5 | 0 | 5 |
| MTF1 | TRIT1 | 0.788697 | 3 | 0 | 3 |
| MTF1 | FCHO2 | 0.784397 | 5 | 0 | 5 |
| MTF1 | TMEM120A | 0.772341 | 6 | 0 | 6 |
| MTF1 | TOM1 | 0.771887 | 10 | 0 | 10 |
| MTF1 | SNX20 | 0.770268 | 3 | 0 | 3 |
| MTF1 | CCNYL1 | 0.770065 | 4 | 0 | 3 |
| MTF1 | FAM214A | 0.763754 | 4 | 0 | 4 |
| MTF1 | GDPD3 | 0.759626 | 8 | 0 | 8 |
| MTF1 | CWH43 | 0.74413 | 8 | 0 | 8 |
| MTF1 | VSIG10L | 0.741501 | 5 | 0 | 4 |
| MTF1 | CYSRT1 | 0.738273 | 5 | 0 | 4 |
| MTF1 | ZNF503-AS1 | 0.737379 | 4 | 0 | 4 |
| MTF1 | NLRX1 | 0.736588 | 10 | 0 | 9 |
| MTF1 | IL36A | 0.736213 | 8 | 0 | 8 |
| MTF1 | PRPF38A | 0.734313 | 4 | 0 | 4 |
| MTF1 | TAB3 | 0.733579 | 6 | 0 | 6 |
For details and further investigation, click here