| Full name: phosphoglucomutase 2 | Alias Symbol: FLJ10983 | ||
| Type: protein-coding gene | Cytoband: 4p14 | ||
| Entrez ID: 55276 | HGNC ID: HGNC:8906 | Ensembl Gene: ENSG00000169299 | OMIM ID: 172000 |
Expression of PGM2:
| Dataset | Gene | EntrezID | Probe | Log2FC | Adj.pValue | Expression |
|---|---|---|---|---|---|---|
| GSE17351 | PGM2 | 55276 | 225367_at | -0.4367 | 0.6554 | |
| GSE26886 | PGM2 | 55276 | 225367_at | -1.5578 | 0.0000 | |
| GSE45670 | PGM2 | 55276 | 225367_at | 0.0402 | 0.8817 | |
| GSE53622 | PGM2 | 55276 | 105470 | -0.9050 | 0.0000 | |
| GSE53624 | PGM2 | 55276 | 105470 | -1.1568 | 0.0000 | |
| GSE63941 | PGM2 | 55276 | 225367_at | 0.8416 | 0.1181 | |
| GSE77861 | PGM2 | 55276 | 225367_at | -1.0802 | 0.0052 | |
| GSE97050 | PGM2 | 55276 | A_23_P7172 | -0.0800 | 0.7973 | |
| SRP007169 | PGM2 | 55276 | RNAseq | -1.6013 | 0.0010 | |
| SRP008496 | PGM2 | 55276 | RNAseq | -1.7397 | 0.0000 | |
| SRP064894 | PGM2 | 55276 | RNAseq | -0.8796 | 0.0025 | |
| SRP133303 | PGM2 | 55276 | RNAseq | -0.7509 | 0.0000 | |
| SRP159526 | PGM2 | 55276 | RNAseq | -1.4588 | 0.0000 | |
| SRP193095 | PGM2 | 55276 | RNAseq | -1.2862 | 0.0000 | |
| SRP219564 | PGM2 | 55276 | RNAseq | -1.1512 | 0.0374 | |
| TCGA | PGM2 | 55276 | RNAseq | 0.2469 | 0.0011 |
Upregulated datasets: 0; Downregulated datasets: 8.
Survival by PGM2 expression:
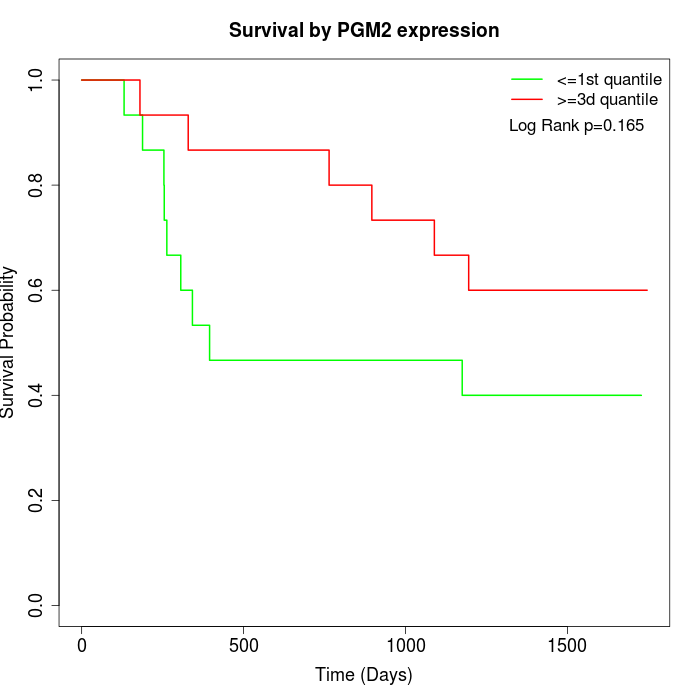 | 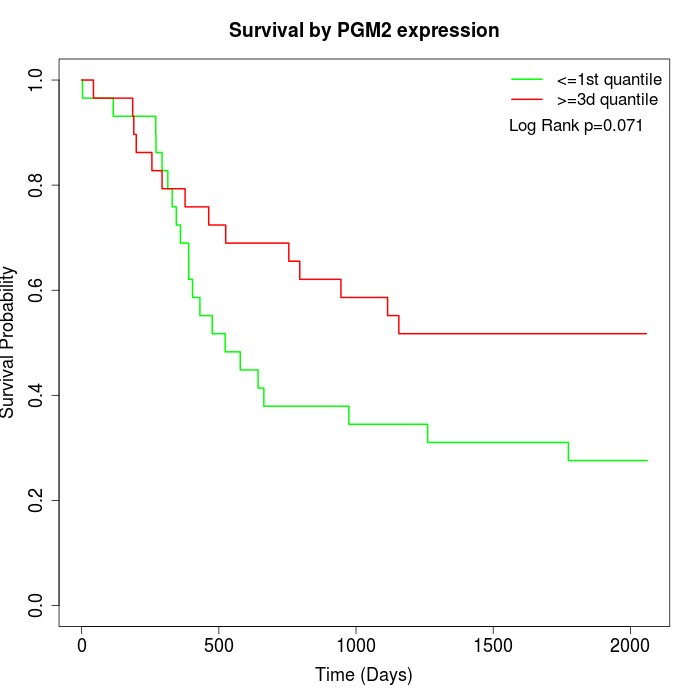 | 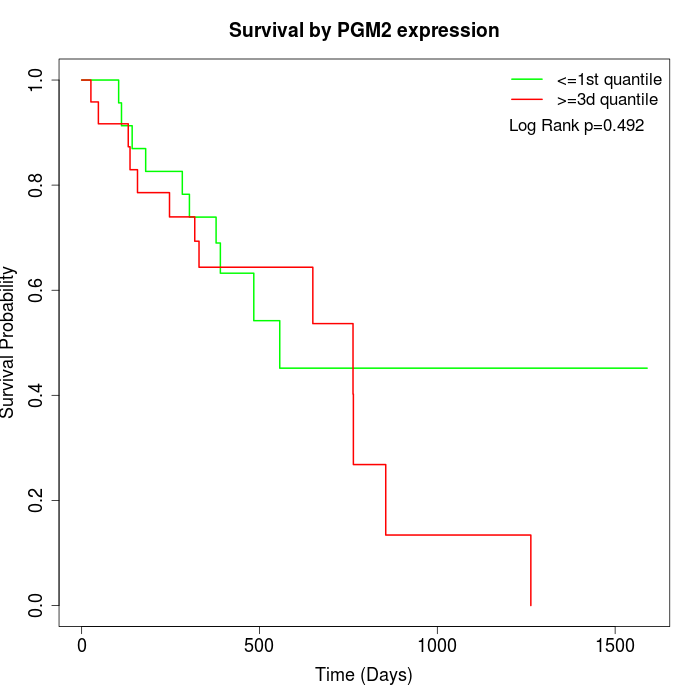 |
| GSE53622 | GSE53624 | TCGA |
Note: Click image to view full size file.
Copy number change of PGM2:
| Dataset | Gene | EntrezID | Gain | Loss | Normal | Detail |
|---|---|---|---|---|---|---|
| GSE15526 | PGM2 | 55276 | 0 | 16 | 14 | |
| GSE20123 | PGM2 | 55276 | 0 | 16 | 14 | |
| GSE43470 | PGM2 | 55276 | 2 | 13 | 28 | |
| GSE46452 | PGM2 | 55276 | 1 | 36 | 22 | |
| GSE47630 | PGM2 | 55276 | 1 | 19 | 20 | |
| GSE54993 | PGM2 | 55276 | 8 | 0 | 62 | |
| GSE54994 | PGM2 | 55276 | 4 | 10 | 39 | |
| GSE60625 | PGM2 | 55276 | 0 | 0 | 11 | |
| GSE74703 | PGM2 | 55276 | 1 | 11 | 24 | |
| GSE74704 | PGM2 | 55276 | 0 | 9 | 11 | |
| TCGA | PGM2 | 55276 | 11 | 46 | 39 |
Total number of gains: 28; Total number of losses: 176; Total Number of normals: 284.
Somatic mutations of PGM2:
Generating mutation plots.
Highly correlated genes for PGM2:
Showing top 20/1554 corelated genes with mean PCC>0.5.
| Gene1 | Gene2 | Mean PCC | Num. Datasets | Num. PCC<0 | Num. PCC>0.5 |
|---|---|---|---|---|---|
| PGM2 | MKKS | 0.797125 | 3 | 0 | 3 |
| PGM2 | EPGN | 0.790477 | 3 | 0 | 3 |
| PGM2 | MTF1 | 0.790104 | 5 | 0 | 5 |
| PGM2 | NIPAL1 | 0.787099 | 3 | 0 | 3 |
| PGM2 | CCDC25 | 0.786148 | 3 | 0 | 3 |
| PGM2 | NUAK2 | 0.784426 | 3 | 0 | 3 |
| PGM2 | PRKCH | 0.783888 | 5 | 0 | 5 |
| PGM2 | TMEM79 | 0.774471 | 7 | 0 | 7 |
| PGM2 | TIAM1 | 0.770972 | 7 | 0 | 7 |
| PGM2 | CNFN | 0.770305 | 6 | 0 | 5 |
| PGM2 | CWH43 | 0.767609 | 6 | 0 | 6 |
| PGM2 | PRSS27 | 0.766777 | 6 | 0 | 6 |
| PGM2 | BTBD11 | 0.764406 | 7 | 0 | 7 |
| PGM2 | ARF6 | 0.763487 | 6 | 0 | 6 |
| PGM2 | MREG | 0.759824 | 7 | 0 | 6 |
| PGM2 | CCDC6 | 0.756971 | 5 | 0 | 5 |
| PGM2 | ERAP2 | 0.75677 | 3 | 0 | 3 |
| PGM2 | CERS3 | 0.756264 | 7 | 0 | 7 |
| PGM2 | IL22RA1 | 0.756049 | 4 | 0 | 3 |
| PGM2 | CAPN14 | 0.755806 | 6 | 0 | 6 |
For details and further investigation, click here